


 37 / 94

Financial Outlook of the OIC Member Countries 2017
25
As shown in the above figure, all OIC group data recording higher ROA ratio compared to the
world average. Although this could be interpreted as the efficiency of these economies, this
situation could also be explained by weak asset base of financial intermediaries, lack of
competition and shallow structure of the market. The World average which was realized as
1.2 percent in 2012 decreased continuously over the selected period and reached to 1 percent
in 2015. During the same period, OIC average decreased from 1.6 to 1.3 percent. ROA for OIC-
HIG group performed better than all other countries and hovered around 1.7 percent during
the selected period.
Bank Return on Equity (ROE)
is another ratio used to measure efficiency of financial
intermediaries. The ROE measures a corporation's profitability by revealing how much profit a
company generates with the money shareholders have invested. It is calculated as a ratio of
commercial banks’ after-tax net income to yearly averaged equity.
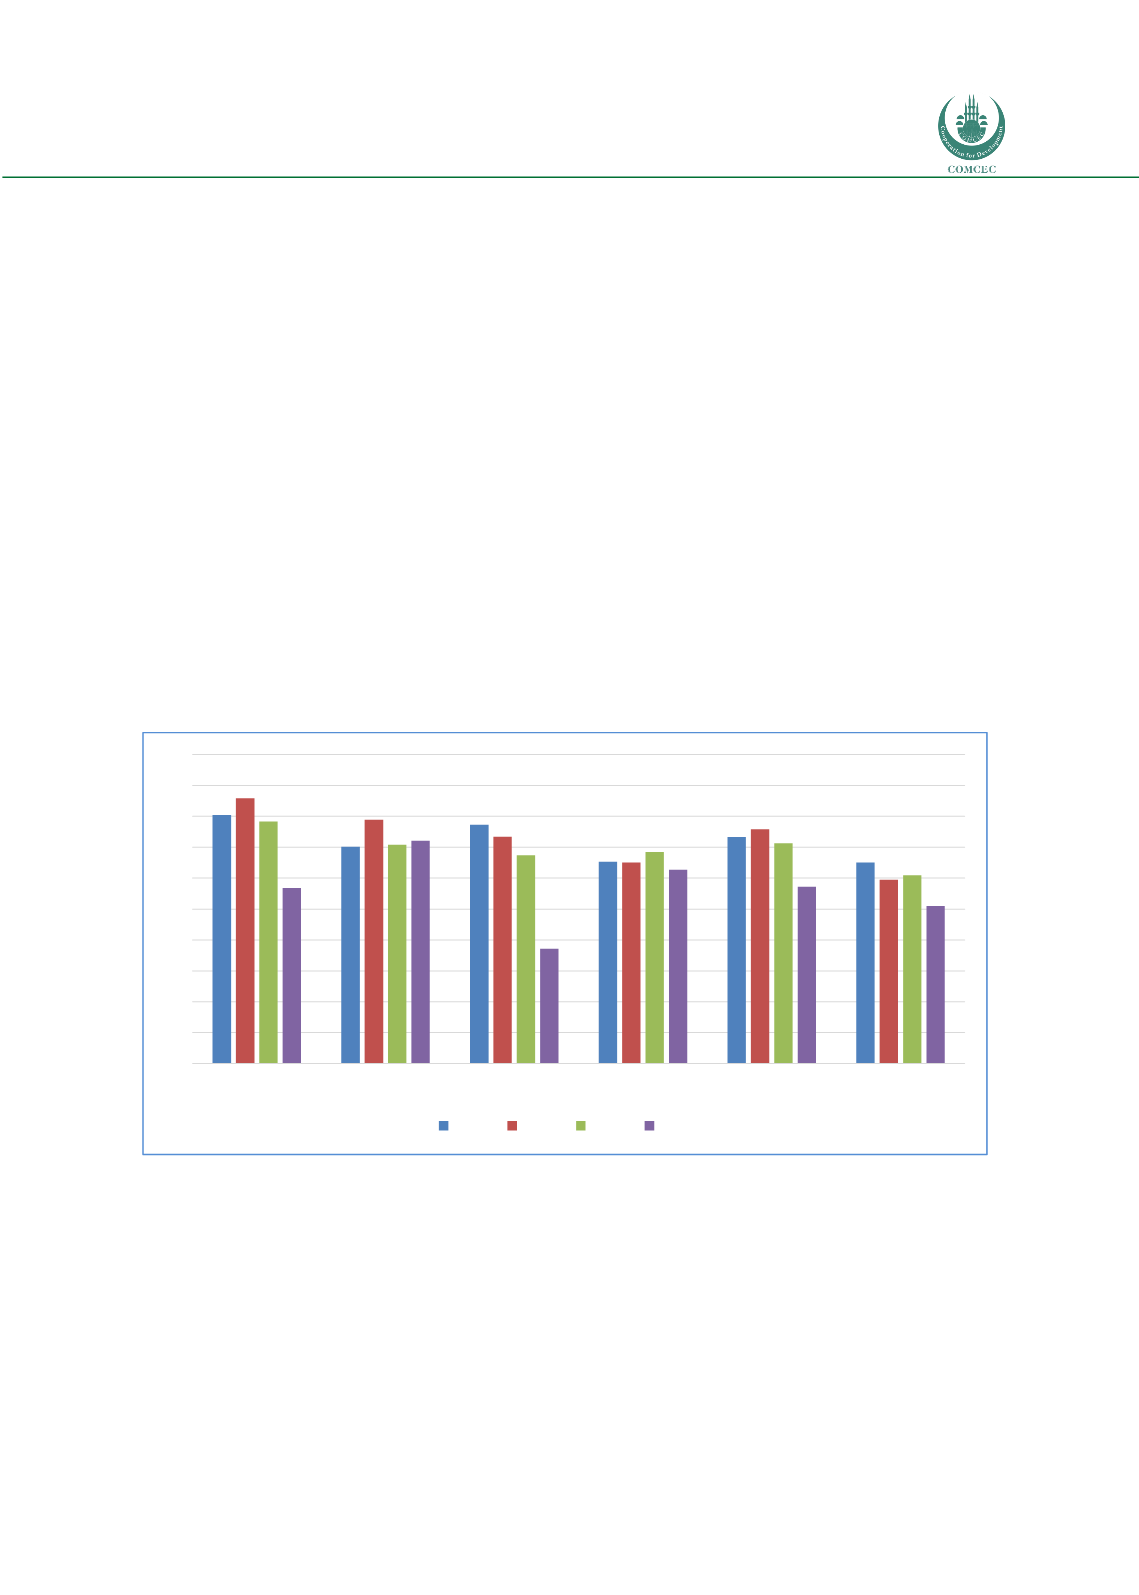
The figure below shows the ROE data for OIC income groups and the World average
performance during 2012-2015. OIC group average performed better than the world average
while it has been declined since 2013 up to 2015. The same trend has been also recorded for
the world average which declined to 10 percent in 2015 after realized as 13 percent in 2012.
The highest rates have been recorded for OIC-LIG countries while there was a significant drop
in the last year.
Figure 22: Bank Return on Equity (%, after tax)
Source: Authors’ calculation from the World Bank Database
As a result, in terms of the efficiency characteristic, the OIC average has performed slightly
better than the world average for the selected indicators over the period between 2012 and
2015. It has been noted that the averages of the high and upper middle income group countries
performed better than the world average which highlights the level of development of the
financial markets and institutions in these countries. As for this characteristic, the low income
segments of the countries should be targeted to increase financial efficiency in order to
support further economic development.
0
2
4
6
8
10
12
14
16
18
20
OIC-LIG
OIC-LMIG OIC-UMIG
OIC-HIG OIC-Average World Average
2012 2013 2014 2015