
30
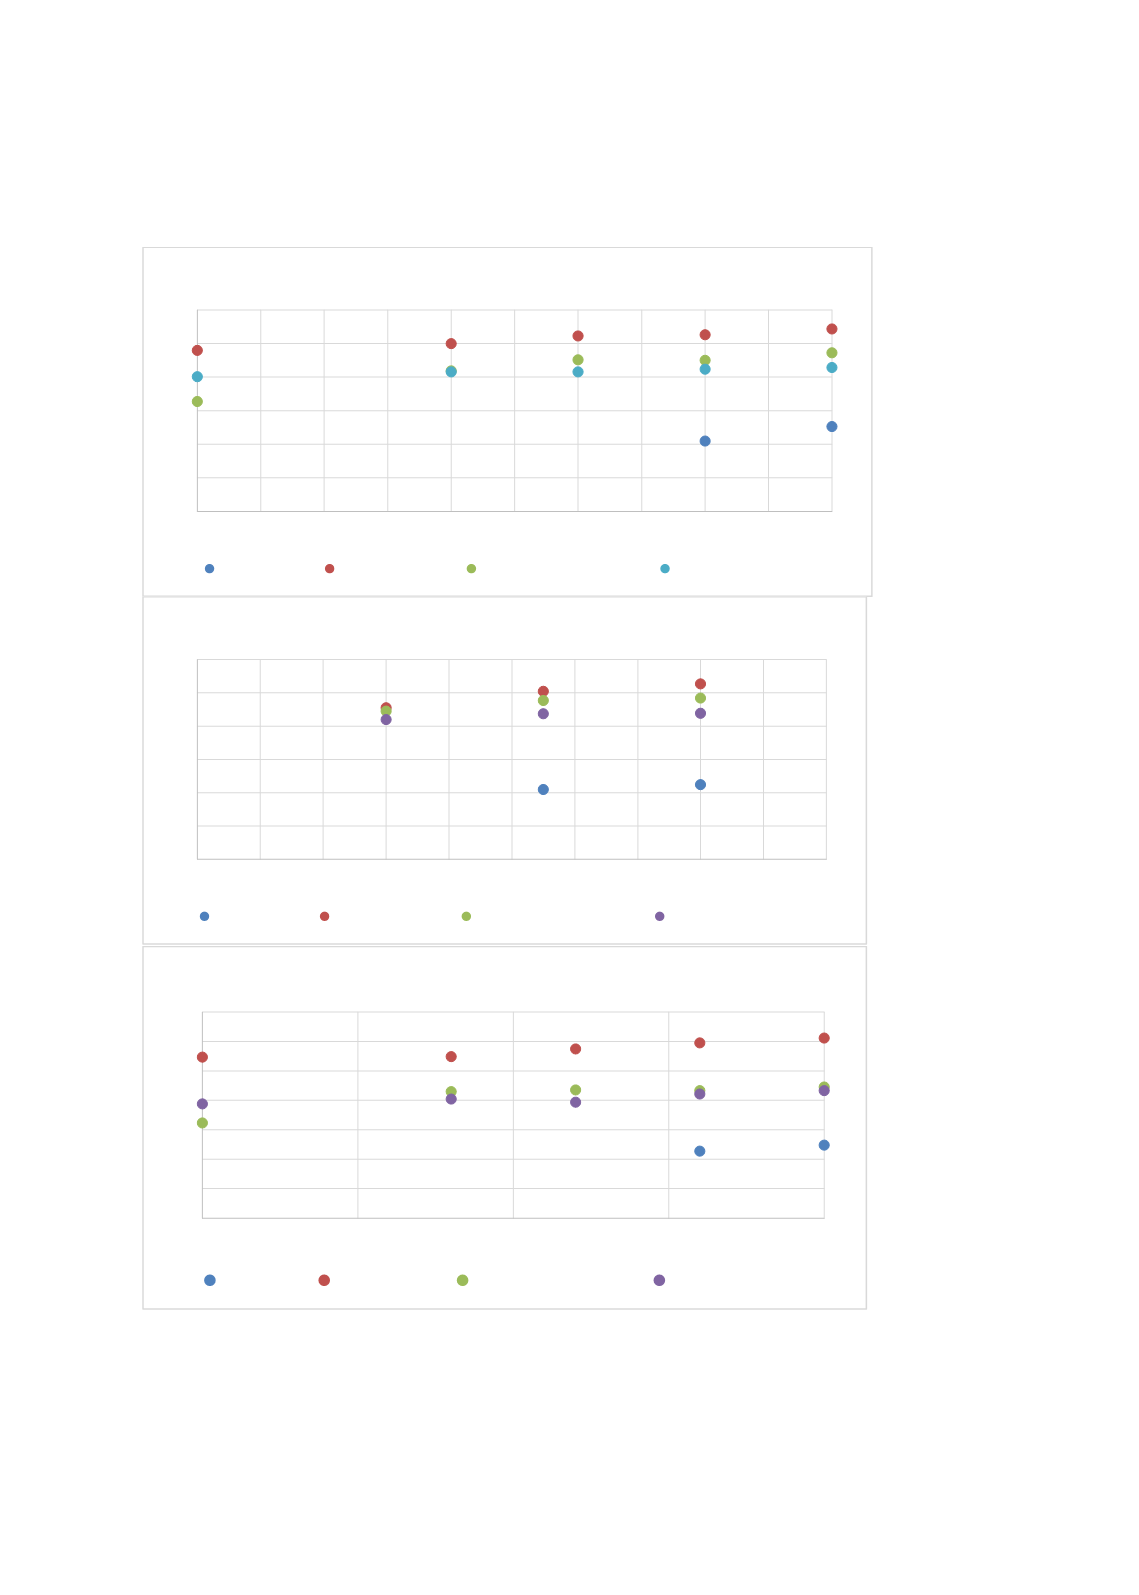
Figure 2.11: Grade 4 TIMSS (Mathematics & Science) and PIRLS (Reading) Scores by Region,
1995-2015
Source: Author’s calculation based on WIDE data. African and Latin American countries have been excluded.
The same pattern prevails in TIMSS science scores as well as PIRLS reading scores. In case of
PIRLS, the gap is striking because all other country groups – HPEAs, Other Asian and Europe and
300
350
400
450
500
550
600
1995 1997 1999 2001 2003 2005 2007 2009 2011 2013 2015
Science scores in TIMSS (grade 4)
OIC Science
HPEAs Science
OTHER ASIAN Science
EUROPE-NA Science
300
350
400
450
500
550
600
1995 1997 1999 2001 2003 2005 2007 2009 2011 2013 2015
Reading scores in PIRLS (grade 4)
OIC Reading HPEAs Reading OTHER ASIAN Reading EUROPE-NA Reading
300
350
400
450
500
550
600
650
1995
2000
2005
2010
2015
Math scores in TIMSS (grade 4)
OIC Math HPEAs Math OTHER ASIAN Math EUROPE-NA Math


