
31
North America – have scores above the 500mark while the average for OIC is around 400 points.
This suggests that OIC as a group is behind other major groups in terms of student achievement
in the early (i.e. primary) cycle of the education system.
Figure 2.12
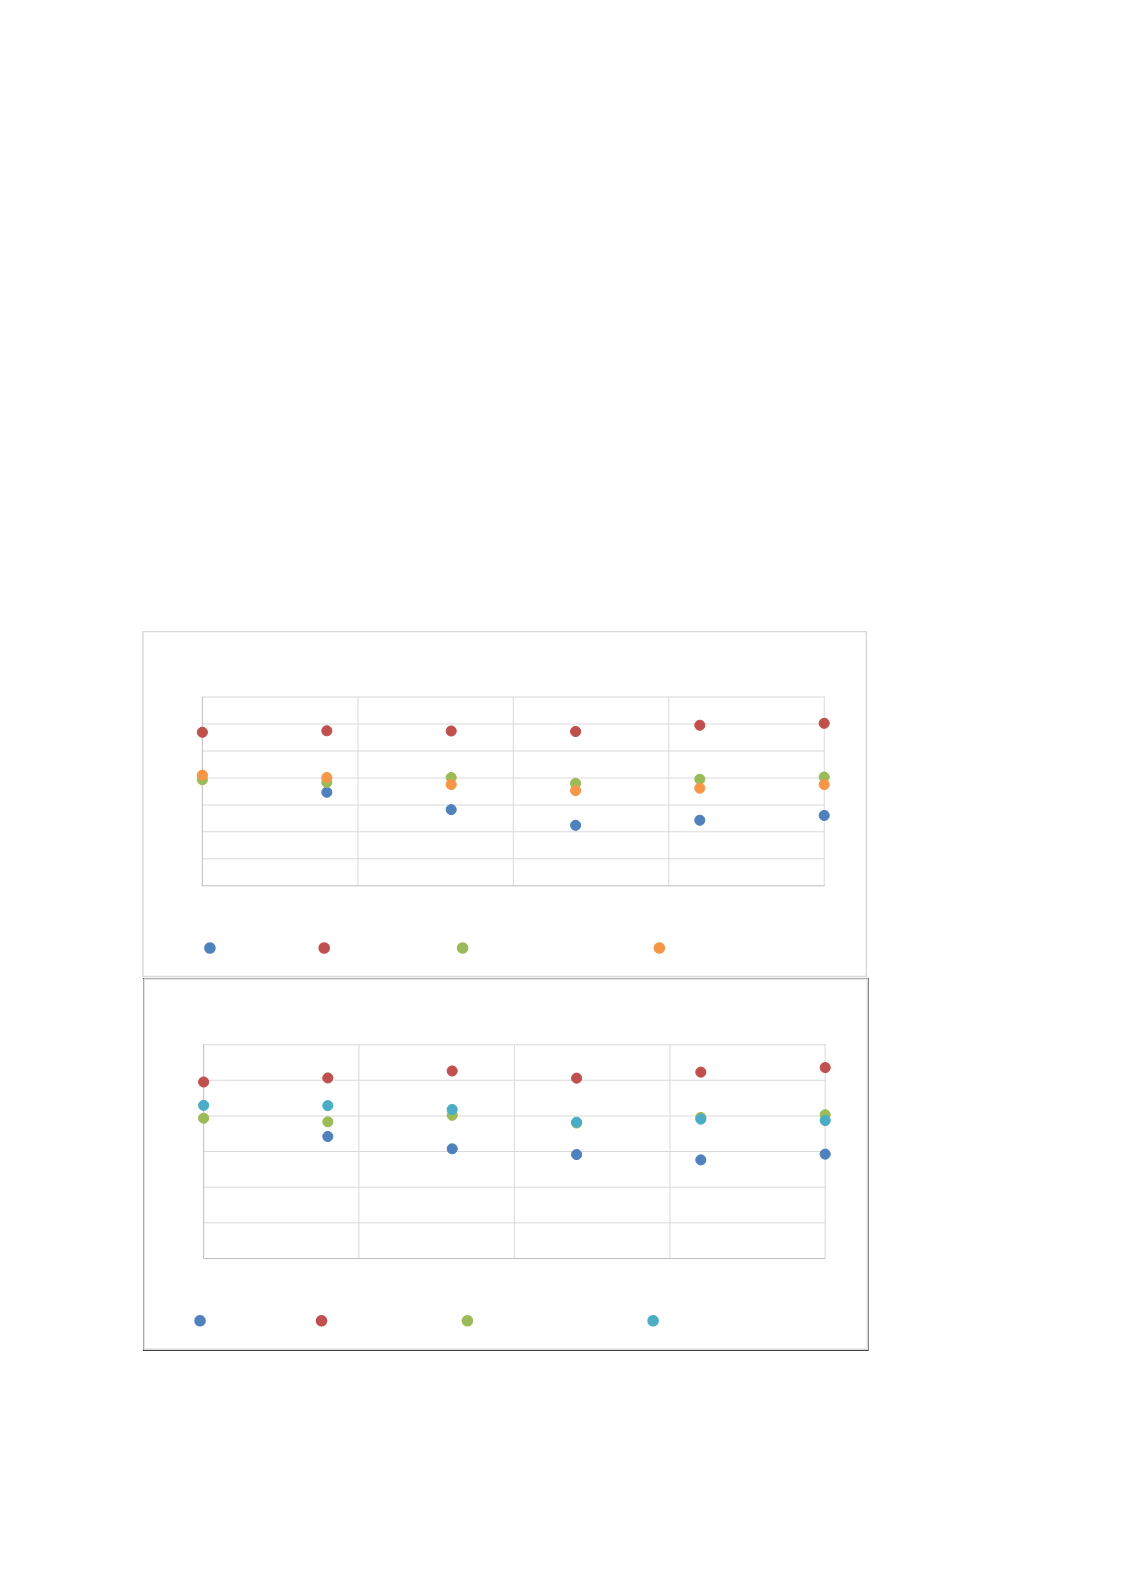
repeats the analysis plotting aggregate data for OIC countries that participated in
TIMSS grade 8 assessments. Compared to grade 4, two OICmember states (Malaysia and Jordan)
participated in the early rounds of grade 8 assessments so that long-term trend analysis is
possible. Since OIC member states only joined grade 4 assessment in 2011, long-term trends
cannot be analyzed. Once again, the average for HPEAs consistently dominates other groups and
even shows an increasing trend in mathematics. In contrast, the OIC average declines sharply
between 1999 and 2006. Although there is a slight upward recovery by 2011, it is still far below
the 1999 average score. Therefore, in 2015, participating OIC countries on average only
outperforms their economically poorer African counterparts. While there is an increasing trend
in the OIC score, the group average is way below the average for HPEAs as well as other Asian
countries. The pattern in case of science scores is almost identical.
Figure 2.12: Grade 8 TIMSS (Mathematics & Science) Scores by Region, 1995-2015
Source: Author’s calculation based on WIDE data. African and Latin American countries have been excluded.
300
350
400
450
500
550
600
650
1995
2000
2005
2010
2015
Math scores in TIMSS (grade 8)
OIC Math HPEAs Math OTHER ASIAN Math EUROPE-NA Math
300
350
400
450
500
550
600
1995
2000
2005
2010
2015
Science scores in TIMSS (grade 8)
OIC Science HPEAs Science OTHER ASIAN Math EUROPE-NA Science


