


 41 / 253

29
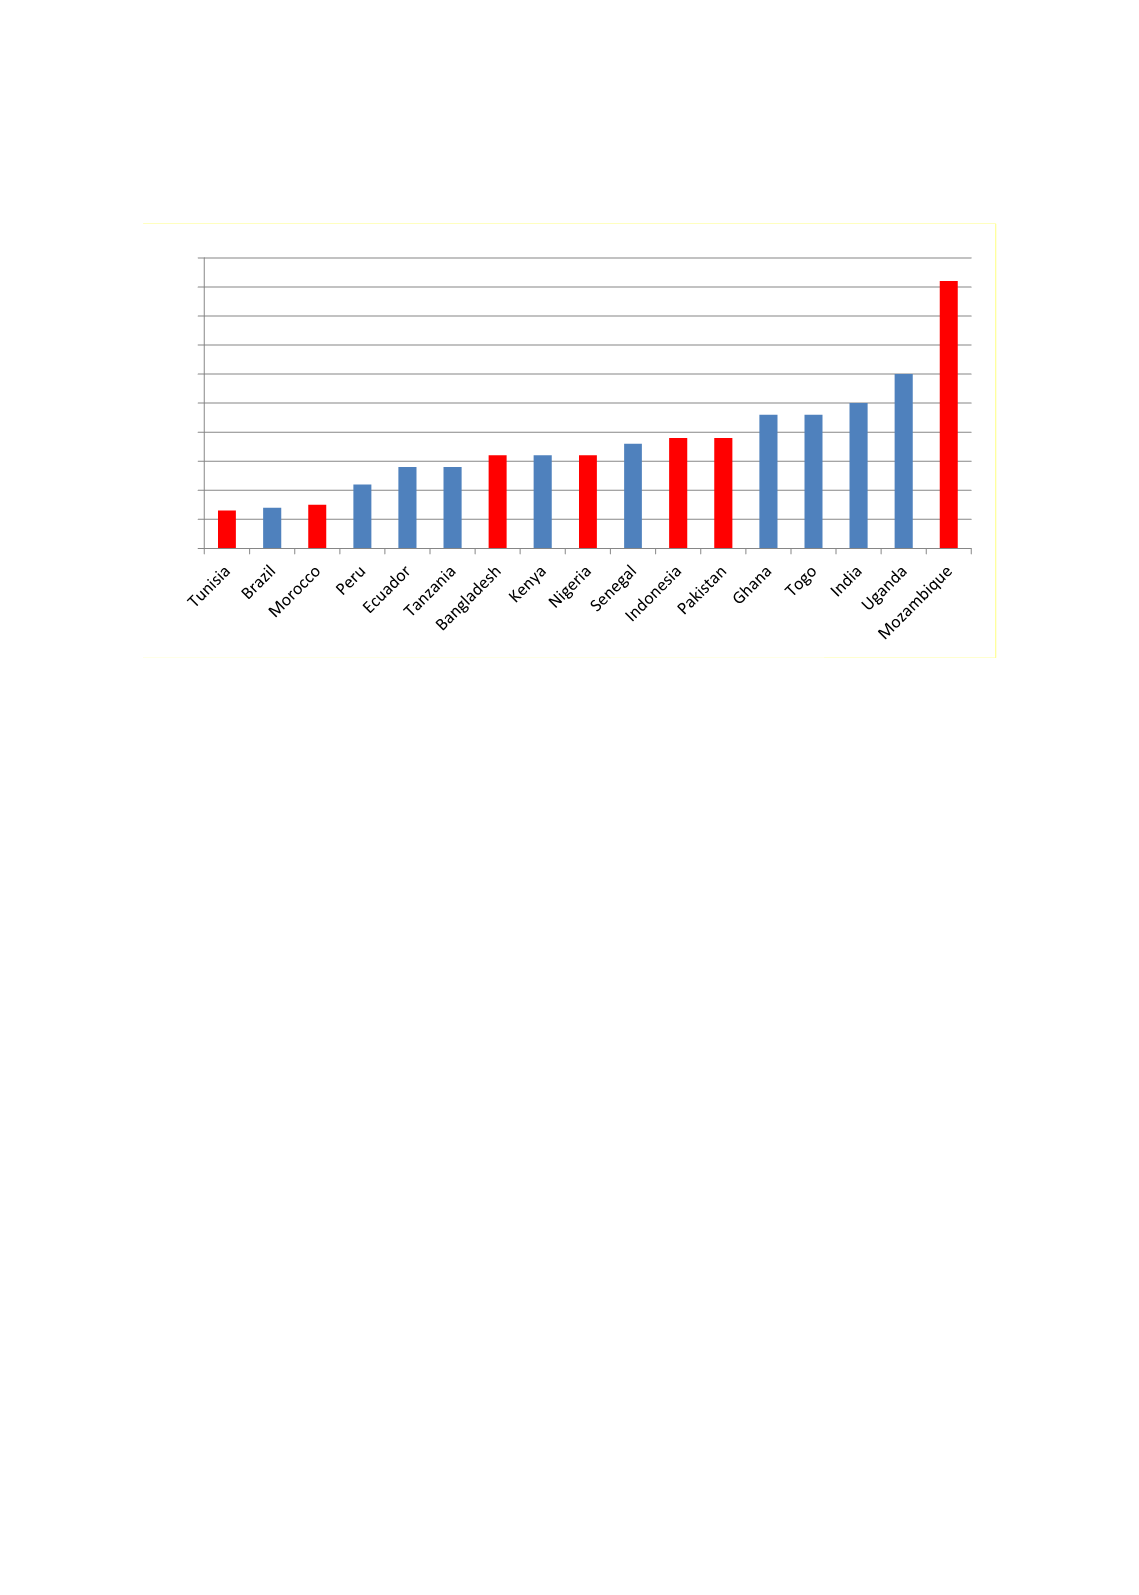
Figure 2.10: Absenteeism from School (%)
Source: Author’s calculation based on data presented in Brixi, Lust and Woolcock (2015)
2.1.3.
Trends in Learning Outcomes
This section summarizes the trends in key measures of student learning in math, science and
reading in OIC countries and the rest of the world. The x-axis presents the year of assessment
while the y-axis shows the level of student achievement. In addition to total scores, the
discussion also focuses on specific levels of competencies achieved for illustrative purposes. The
analysis is strictly based on participating countries. It should be also noted that participation
rate increases over time so that part of the long-term trend is driven by the change in sample
composition of OIC countries represented in these assessment exercises.
Figure 2.11
shows aggregate trends in OIC countries that participated in TIMSS grade 4
assessments. Since OICmember states only joined grade 4 assessment in 2011, long-term trends
cannot be analyzed. For comparison purposes, other participating countries have been
categorized into five groups - high performing East Asian economies (HPEAs), other Asian
countries (OTHER ASIAN), Europe & North America (ERUPE-NA) and Latin American countries
(LATIN AMERICA). For HPEAs, there is a clear long-term increasing trend in average TIMSS
score in grade 4 mathematics. This is also true for European and Northern American countries
though the trend is weaker. While there is an increasing trend in the OIC score, the group
average is way below the average for HPEAHPEAs as well as other Asian countries (e.g. Estonia).
In 2015, the OIC group average score was below the 450 mark while the group average of HPEAs
was above 600 points.
0
5
10
15
20
25
30
35
40
45
50