
Increasing Broadband Internet Penetration
In the OIC Member Countries
140
Major factors that influence use of fixed and mobile broadband
Despite the high penetration of the Internet, a portion of the Kazakh population has not yet
adopted it. To estimate the portion of non-adopters, the demand gap statistic is relied upon.
The demand gap measures the difference between the population that can purchase
broadband service because of service availability, and the individuals that actually acquire
service; this serves to calculate the number of non-adopters for reasons other than lack of
coverage. Considering that mobile broadband coverage of the population has reached 75% by
the end of 2015, this would indicate that the demand gap is 42%. As table 78 indicates, the
demand gap has been increasing over time because the rate at which operators are deploying
mobile broadband networks is higher than the speed of subscriber growth.
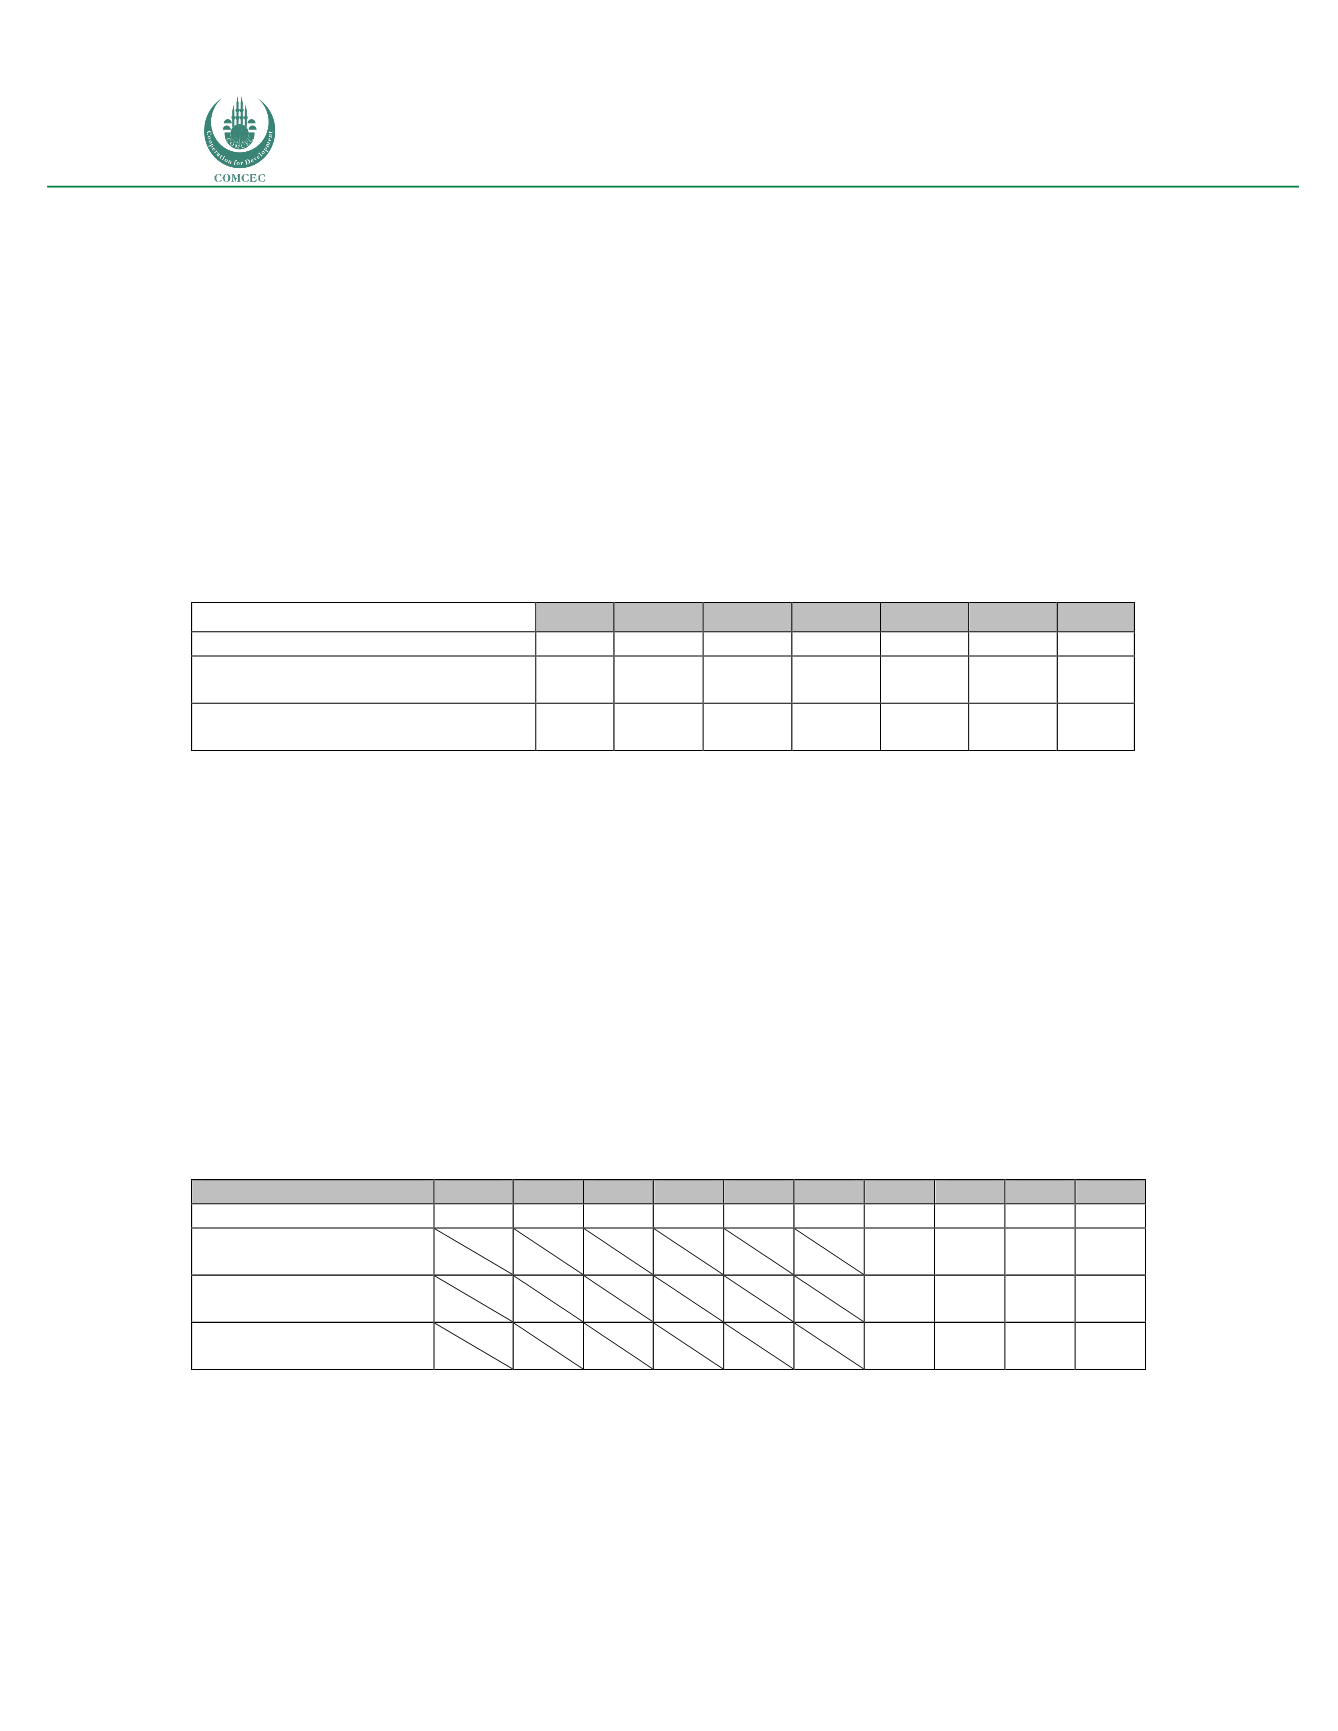
Table 78: Kazakhstan: Mobile broadband demand gap (2010-2016) (%)
2010 2011 2012 2013 2014 2015 2016
Population coverage
7.38 14.75 29.50 59.00 59.00 72.70 73.00
Unique subscribers as % of
Population
0.34 2.08 4.59 9.17 15.51 22.34 31.18
Demand gap (based on unique
subscribers)
7.04 12.67 24.91 49.83 43.49 50.36 41.82
(*) Estimated
Sources: GSMA Intelligence; International Telecommunications Union; Telecom Advisory Services analysis
A note of caution should be made in interpreting the figures in Table 78. To calculate the
demand gap, mobile broadband penetration metrics are based not on the number of
connections but on unique subscribers, which considers unique users rather than the number
of SIM cards. Thus, considering the accelerated geographic deployment of mobile broadband
networks, the demand gap has been increasing until 2016, when a slow-down in deployment
has resulted in a reduction of the demand gap. While a gradual reduction in the demand gap is
forecast, as of now 42% of the population currently reached by mobile broadband networks
does not purchase the service. One reason for non-adoption could be limited affordability.
However, as indicated in table 79, pricing of some of the more economic broadband
subscription plans in the country has been decreasing significantly.
Ta le 79: Kazakhstan: Pricing of broadband subscriptio s (2006-2015) (in US$)
Monthly subscription 2006 2007 2008 2009 2010 2011 2012 2013 2014 2015
Fixed-broadband
157.82 31.01 20.14 13.09 13.10 23.87 12.94 12.69 10.77 8.70
Mobile broadband USB
1GB, postpaid
6.64 6.51 5.52 4.46
Mobile broadband
handset 500M
6.64 6.51 5.52
..
Mobile broadband
handset 500MB, prepaid
6.64 6.51 5.52 4.46
Source: International Telecommunications Union; Telecom Advisory Services analysis
As data in table 79 indicates, broadband prices have been dropping across the board, primarily
driven by competition (see supply section below). Price declines have led to an increase in
Kazakhstan digitization affordability index, which has risen from 50.04 in 2006 to 94.98 in


