
Increasing Broadband Internet Penetration
In the OIC Member Countries
138
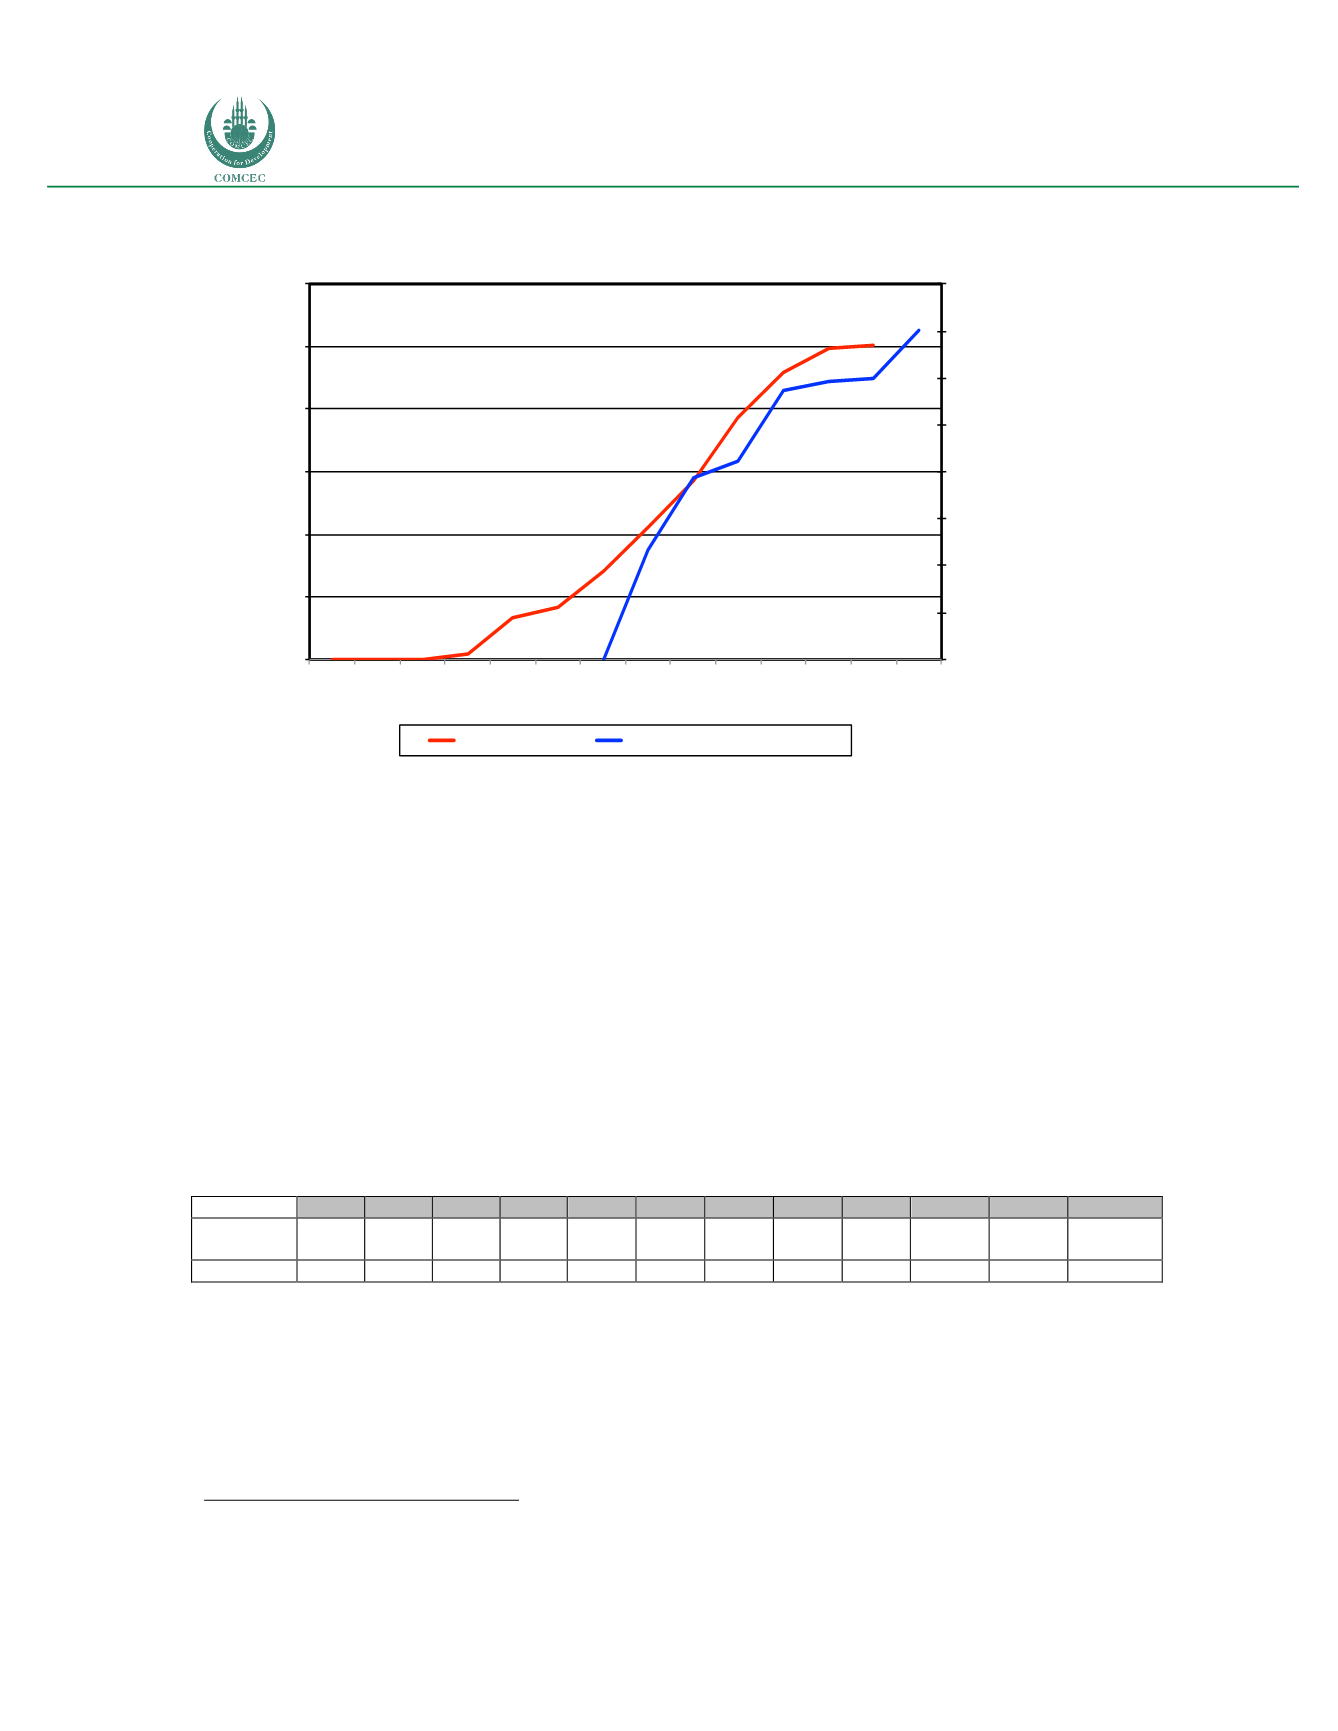
Figure 39: Kazakhstan: Comparative adoption of fixed and mobile broadband (2003-2016)
Source: GSMA Intelligence; International Telecommunications Union; Telecom Advisory Services analysis.
As figure 39 indicates, the deployment of mobile broadband networks in Kazakhstan resulted
in a complementary effect, whereby each technology is adopted to fulfill specific functions (e.g.
video distribution and data rich Internet access in the household vs. light data applications
through the mobile platform). This could be explained by the fast deployment of fiber optics, a
fixed technology that portends a specific set of differentiated features relative to mobile
broadband.
Most common purposes of Internet use
The International Telecommunications Union reports that 73% of the population of
Kazakhstan in 2015 accessed the Internet on a regular fashion (see table 76).
Table 76: Kazakhstan: Population accessing th Inte net (2003-2015)
2003 2005 2006 2007 2008 2009 2010 2011 2012 2013 2014 2015
Users (‘000)
295 446 498 619 1,712 2,865 5,031 8,146 8,676 10,358 10,961 12,221
% Pop.
2.00 2.96 3.27 4.02 11.00 18.20 31.60 50.60 53.32 63.00 66.00
72.87
Sources: International Telecommunications Union; Telecom Advisory Services analysis
While there are no official statistics of the geographic distribution of Internet users, some
analysts consider that more than 35% of Internet users are concentrated in the city of
Almaty
85
. However, Internet usage is fairly limited in terms of accessing a social network such
as Facebook. As of 2016, Facebook penetration had reached only 8.86% of the population. A
85 Revenue of enterprises providing internet access by regions as of January 2015,” [in Russian] Ranking, February 24, 2015,
http://bit.ly/1DNjp8a.0.00 0.01 0.01 0.79
6.68 8.28
14.07
21.03
28.54
38.73
45.86
49.79 50.23
23.24
38.67
42.26
57.22 59.40 59.97
70.30
0.00
10.00
20.00
30.00
40.00
50.00
60.00
70.00
80.00
0.00
10.00
20.00
30.00
40.00
50.00
60.00
2003 2004 2005 2006 2007 2008 2009 2010 2011 2012 2013 2014 2015 2016
Fixed Broadband
Mobile Broadband Connections
Fixed Broadband
(Percent of households)
Mobile Broadband Connec9ons
(Percent of popula9on)


