


 88 / 186

Urban Transport in the OIC Megacities
78
Table 7: Number of licensed vehicles between 2011 and 2014 in Egypt
Vehicle
2014
2013
2012
2011
Difference
2011 to
2014
Private Car
3,592,822
3,380,104
3,231,513
3,074,862 +17%
Motorcycle
2,135,985
1,772,333
1,674,812
1,509,373 +42%
Lorry and Truck
1,083,938
1,033,849
1,020,378
978,731
+11%
Taxi
320,098
317,253
307,166
359,252
-11%
Other (eg
Political/Governate/Go
vernment etc vehicles)
162,295
165,418
185,879
224,782
-28%
Tourist/Travel/school
bus
72,255
67,849
56,139
54,924
+32%
Tuk Tuk
65,844
51,213
49,574
0
Private Bus
38,227
36,672
31,556
36,270
+5%
Public Bus
16,494
16,420
19,417
19,104
-14%
Source: Data from Central Agency for Public Organization and Statistics, 2014
Interestingly whilst this shows a 17% increase in the number of cars licensed between 2011 and 2014,
it shows the phenomenal growth in Motorcycles (42%), a significant growth in trucks (11%) a small
increase in private buses but a large reduction in public buses. It also shows the phenomenal increase
in Tuk Tuk’s from none registered in 2011 to over 65,000 in 2014.
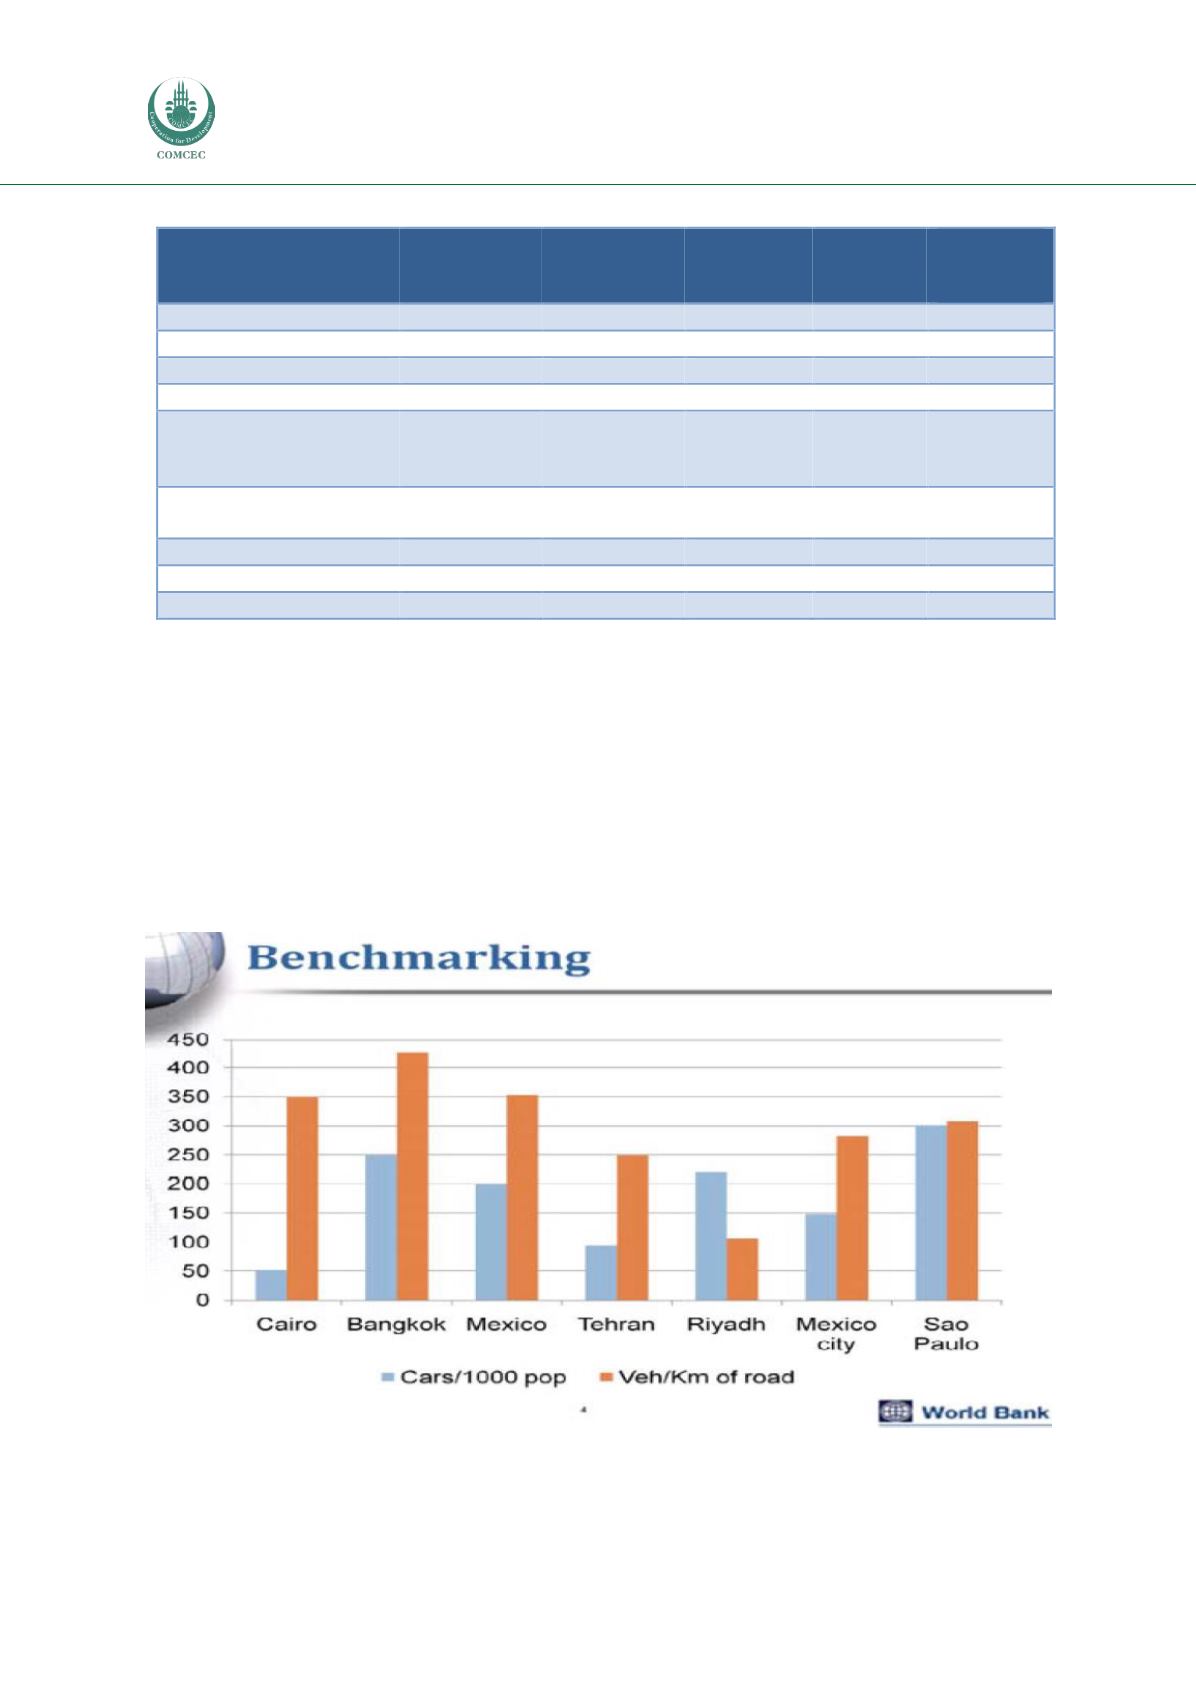
Increased private car ownership: low bank loans, inexpensive fuel and increased local car
production/assembly has compounded the GCR traffic congestion. The figure below compares Cairo
cars per 1000/population (which is relatively lower than other cities) and its vehicles/KM road which
is relatively high and out of proportion with the cars by population:
Figure 18: Number of cars in Cairo compared to other cities
Source: Slide 37 Prof Khaled El Araby International Symposium February 2013