


 87 / 186

Urban Transport in the OIC Megacities
77
African markets. The Suez Canal further enhances this advantage, with 8% of world trade passing
through the vital waterway.
The transportation sector is one of the main drivers of economic development and growth in Egypt,
linking production and consumption markets. Egypt’s unique geographic location combined with an
expanding infrastructure base is enhancing the country’s position as a key global logistics hub. Egypt
is currently embarking on a host of transportation projects in metros and tunnels, railways, ports, and
roads. The OBG’s Egypt 2014 report described the scale and scope of transportation projects in Egypt
as 'breathtaking’. Despite anticipating problems to face some projects, the report concluded that 'even
if only half of the targets are met the total achievements will still be among the largest in Egypt’s
history.’
The Greater Cairo Region (GCR), which includes the governorates of Cairo, Giza, and Qalubiya is among
the largest, fastest growing, and densest major urban agglomerations in the world. Its population is
about 17 million and projected to grow by about 1.7%per year for at least the next decade. Population
density exceeds 800 persons / hectare over much of the urbanized area. The GCR is the dominant
metropolis of Egypt with approximately 20% of the national population and is the centre of economic,
educational, medical, cultural, and governmental activity.
The CGR is also the preeminent transport centre of Egypt accommodating over 20 million motorized
person trips and 7 million non-motorized trips daily. About 2/3 of all motorized trips are made by
public transport, but about half of all motorized vehicles in Egypt operate in the GCR and while the
current car ownership rate is quite low, it will only take a small increase to bring about a dramatic
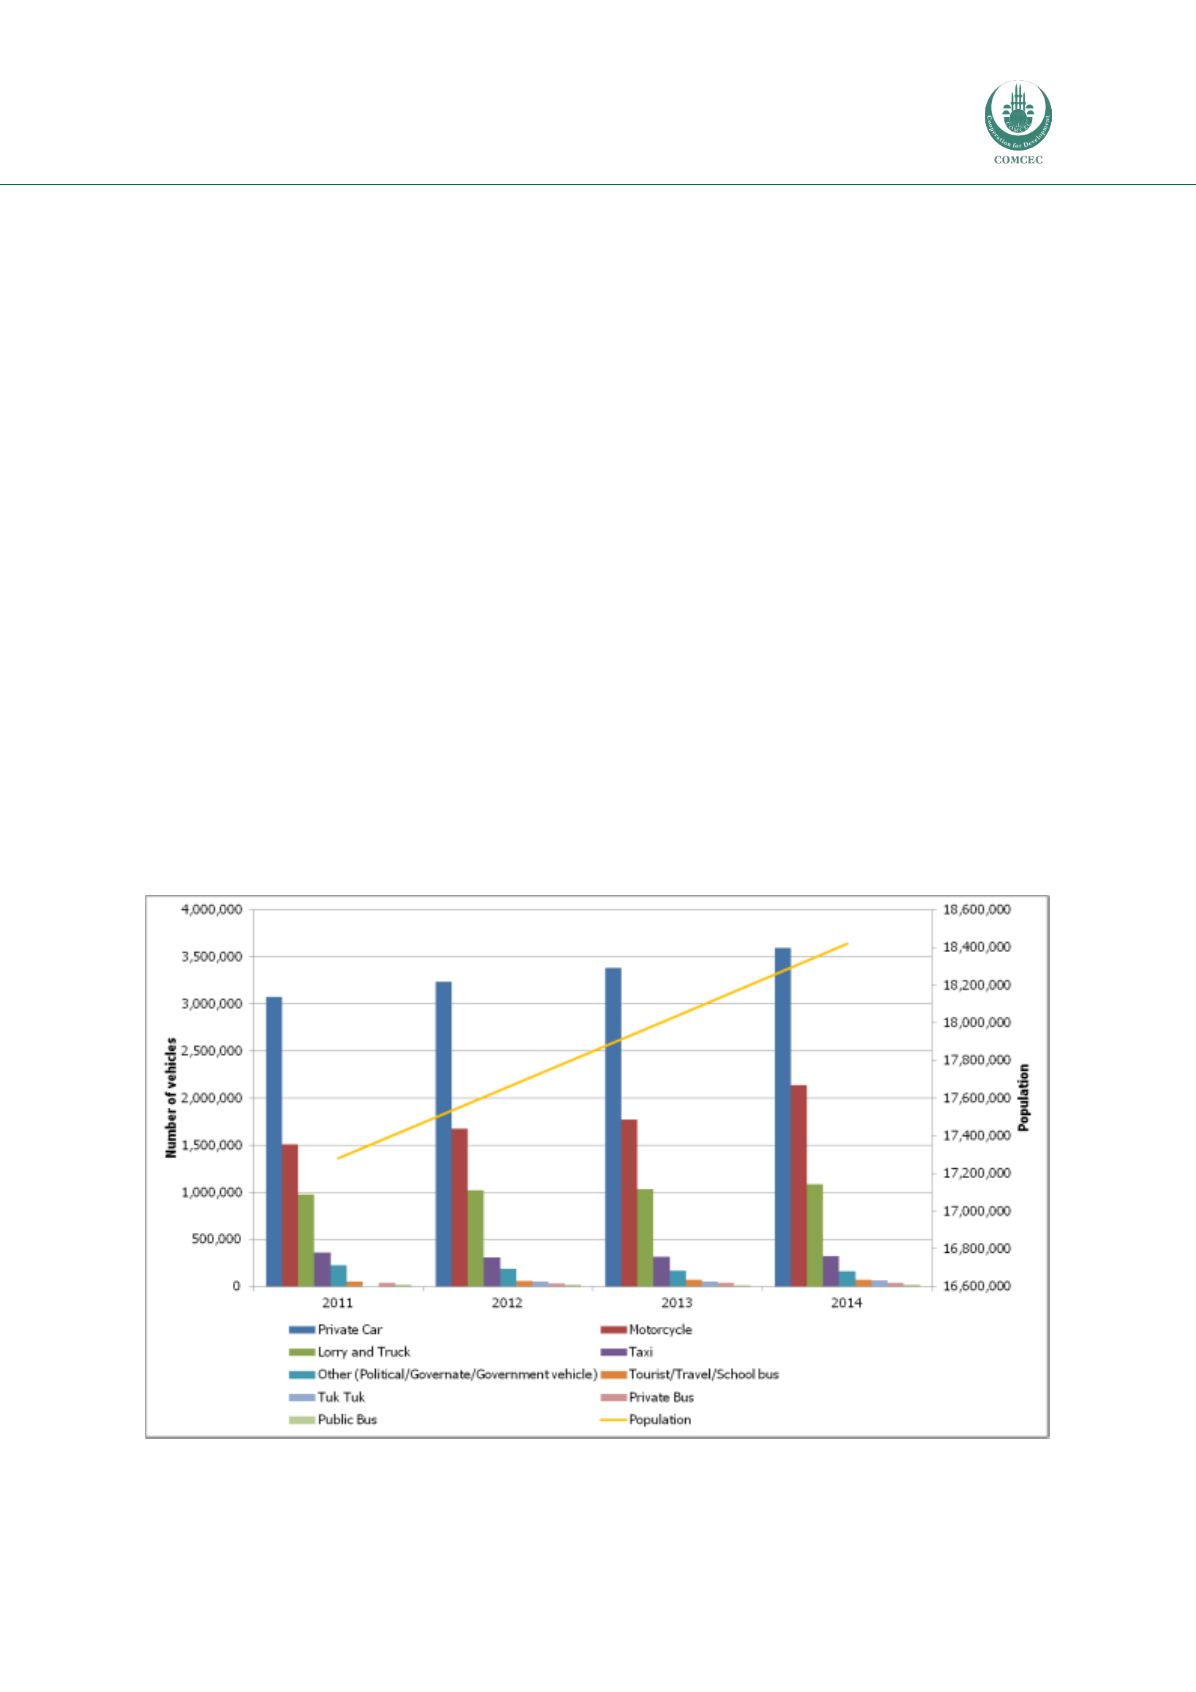
worsening of the traffic congestion that is amongst the worst in the world. The figure below
summarizes licensed vehicle and Cairo population growth in the 2011 to 2014 period and Table 7
indicates the number of licensed vehicles (note data is only available for Egypt as a whole):
Figure 17: Number of licensed vehicles between 2011 and 2014 in Egypt
Source: Data from Central Agency for Public Organization and Statistics, 2014