


 162 / 214

Improving Transnational Transport Corridors
In the OIC Member Countries: Concepts and Cases
148
(see
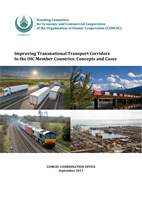
Table 48). The difficulty is the allocation of this waiting time to border, welfare and rest.
The actual border processing times seems surprisingly hard to locate in the NCTTCA data base
and an enquiry from Fimotions only led to back to the total transit times, so it is not possible to
say how long the border processing times were.
Table 48: Transit and waiting times on selected route
Route
Total Transit Waiting %
Mombasa - Kampala
98.4
23.38
75.02
76%
Mombasa - Kigali
132
33.64
98.36
75%
Mombasa - Juba
268.8
33.24
235.56
88%
Assumed average speed
50
Source: Fimotions (2017).
Trends in Road Freight Rates and Costs
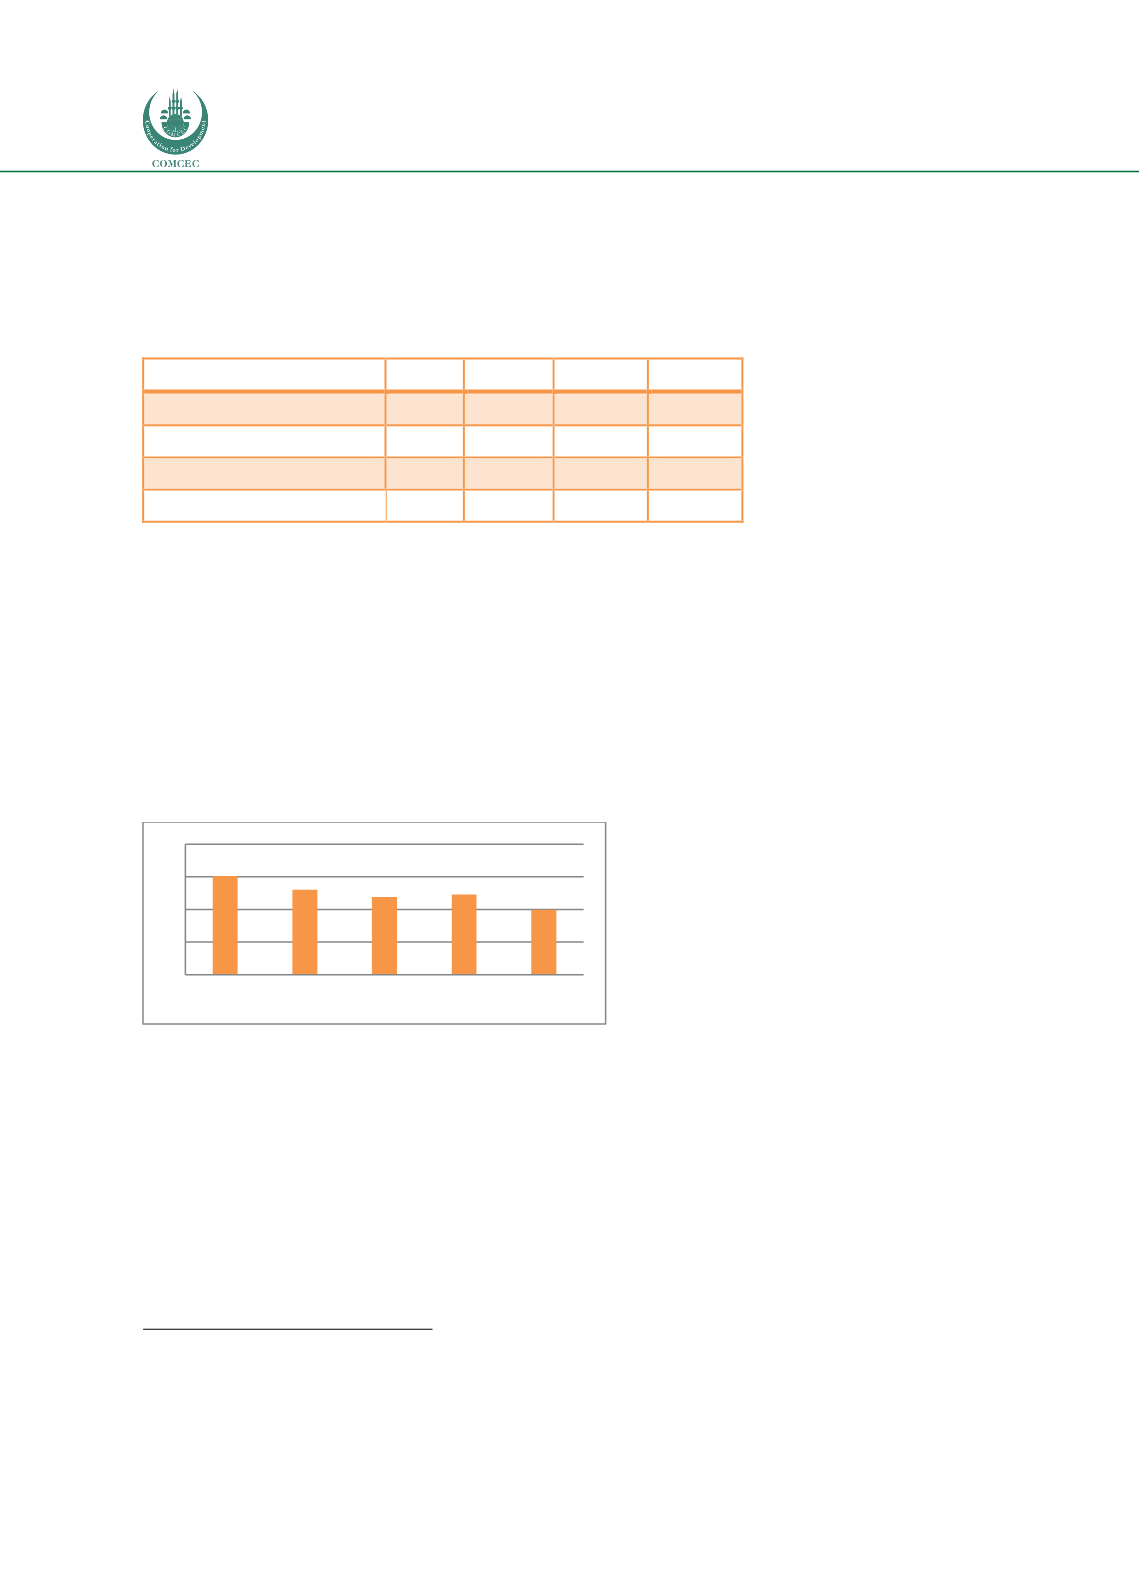
A good indicator of overall improvement in the efficiency of the corridor, is the trend in freight
rates. The main rate is that from Nairobi to Mombasa, for almost all national and international
traffic in the corridor converges and uses this segment. From 2010 to 2016 the average cost of
road freight has declined by about 5% per year as shown i
n Figure 54 74
. The rate from Kigali to
Mombasa has also declined from $2.47 per km in 2014 to $1.76 per km in 2016 according to
the same sources.
Figure 54: Trend in the road freight rates ($/km)
Source: Fimotions (2017), analysis on data provided by TTNCA.
These are financial costs or rates, which are declining due to improvements in the corridor.
However,
the economic cost of transport along the corridor is estimated to be $384.00
more than it should be
due to poor road, excessive stops and waiting time at border
crossings, according to NTTCA latest monitoring report
75
. This is not surprising since the
commercial speeds are only 6 kph to 13 kph which generates excessive time-based costs.
These costs add approximately $0.25 per veh-km and clearly the removal of these costs will
generate significant economic benefits.
74
http://top.ttcanc.org/indicators.php?indicatorviewid=2012042709383376241&indicatorgroupid=275
TTNCA Monitoring Report May 2017 (draft)
0
1
2
3
4
2010 2012 2014 2015 2016