


 161 / 214

Improving Transnational Transport Corridors
In the OIC Member Countries: Concepts and Cases
147
level of penetration and use of the internet that is problematic for Africa
73
. Generally, internet
penetration is computed as being 27.7% of the population compared to the rest of the world of
54%. In the study area Kenya has the highest internet penetration in all of Africa of 77% while
the DRC is the lowest at 3.8%.
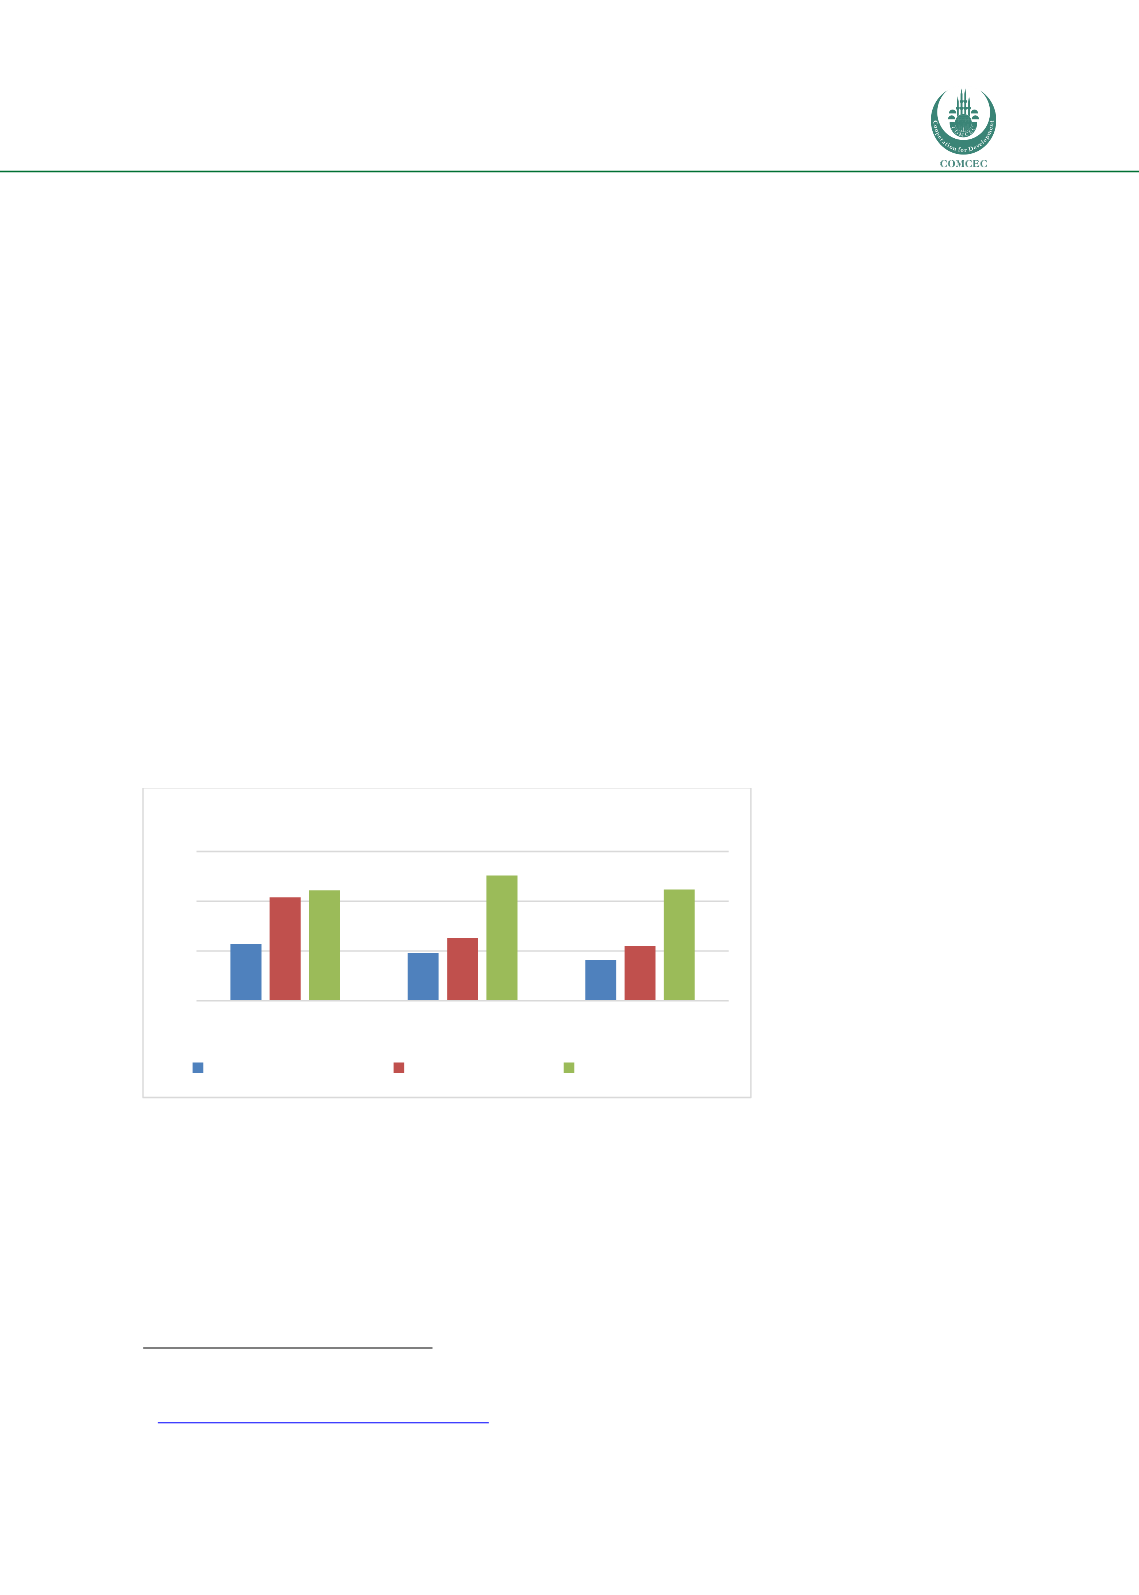
Transit times
Transit times from Mombasa to other destinations along the Northern Corridor are captured
through Global Positions System devices that are installed on selected sample of trucks plying
the Corridor. The GPS tracks time from when the truck leaves Mombasa up to arrival at the
various destinations. The data shows that transit time from Mombasa to Kigali and Juba
declined during the period from October 2016 to March 2017. The performance can be further
improved given that the minimum recorded for the period were, 40 hours, 60 hours and 105
hours for Kampala, Kigali, and Juba respectively. An analysis of the change or trend in transit
times was carried out – refer to
Figure 53.Improvement in times are noted for Kampala and
Kigali to Mombasa, due mostly to reduced border waiting time. Given the times and distances,
the average commercial speeds have been computed ranging from just 6 to 13 kph. Almost
certainly this is no better than rail of 100 years ago. It is to be noted that a typical truck in
transit between Kampala and Mombasa may be stopped 20 times or more due to BPs, Road
Blocks and Weigh Bridges
Figure 53: Changes in transit time in Northern Corridor
Source: Fimotions (2017), analysis on data provided by NCTTCA.
Transit and Waiting Times
Some special analysis was carried out to see what amount of time was spent in motion or
waiting, in the three main routes in the Corridor. Assuming an average speed in motion of 50
kph, the average time trucks spent waiting ranged from 75% to 88% of the total transit time
7
3 http://www.internetworldstats.com/stats1.htm0
5
10
15
9/15-3/16
4/16 - 9/16
10/16-3/17
Trends in Journey Time (days)
Mombasa Kampala Mombasa Kigali
Mombasa Juba