
Improving Transnational Transport Corridors
In the OIC Member Countries: Concepts and Cases
143
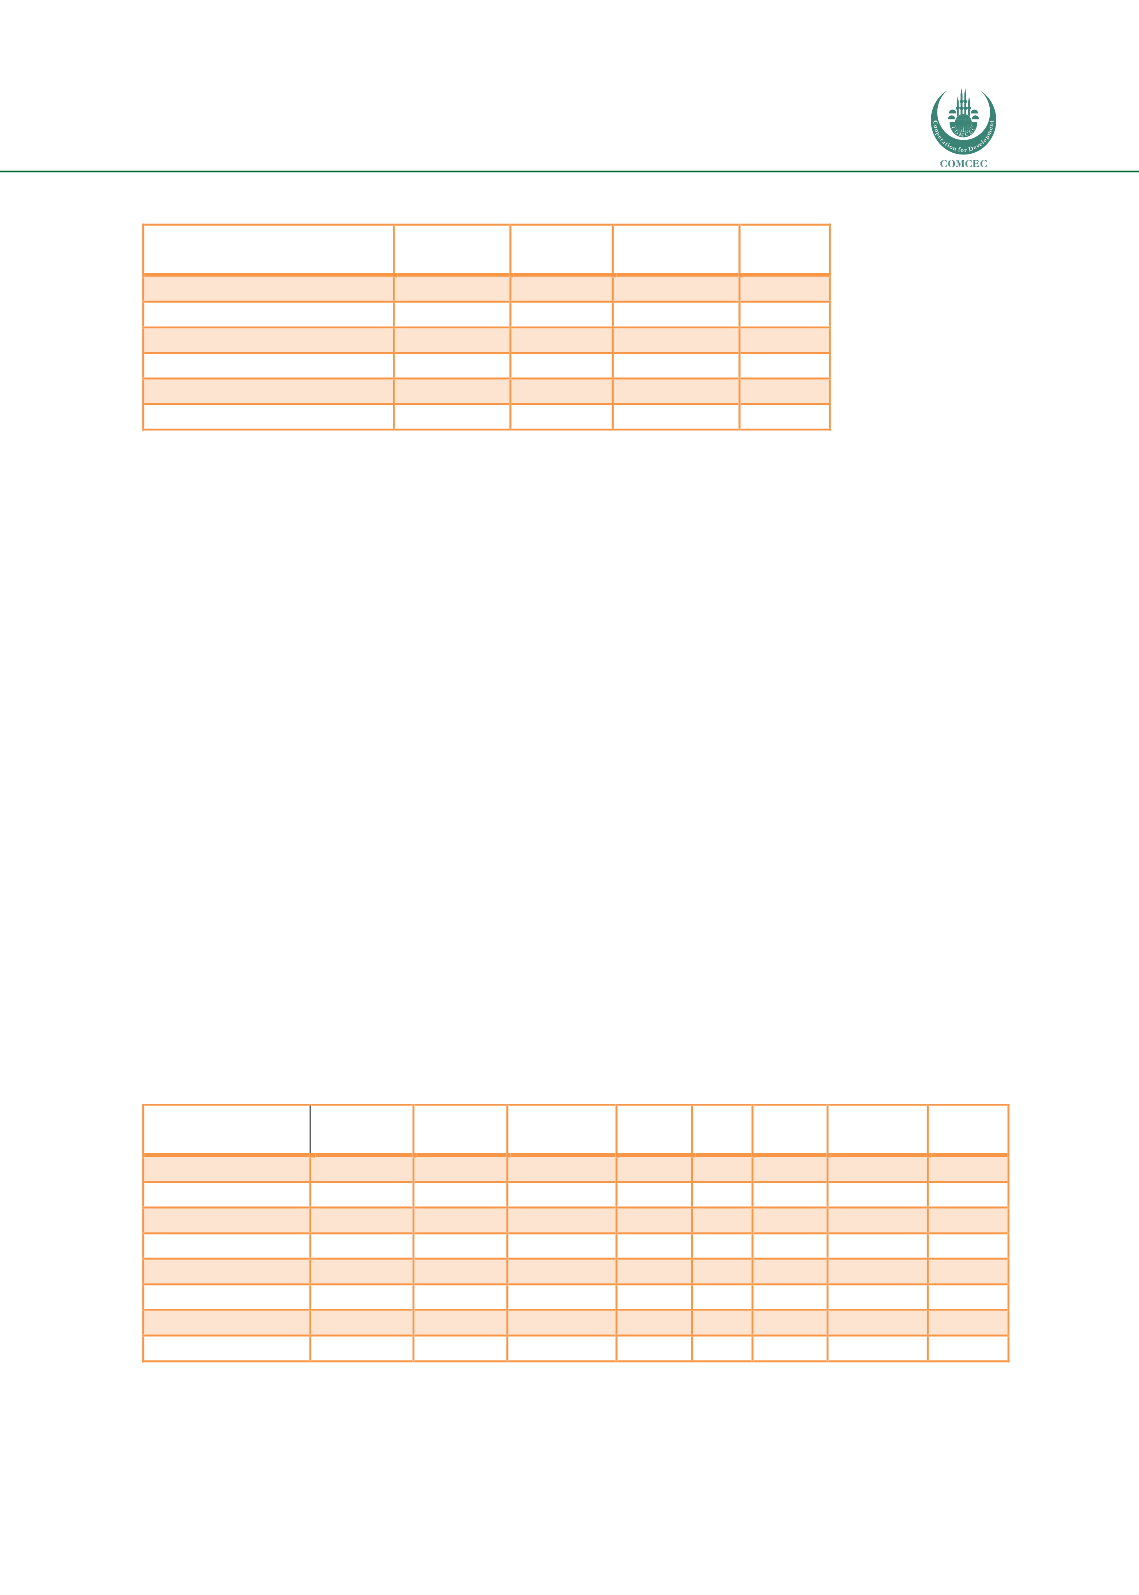
Table 46: Traffic flows on sections of the Northern Corridor
Passenger
Cars
Trucks
Minibuses
Buses
Mombasa-Nairobi
1,995
1,187
54
78
Nairobi-Eldoret
1,897
943
75
95
Eldoret-Kampala
1,639
781
70
92
Kampala-Mbarara
1,883
596
150
60
Mbarara-Kigali
1,498
415
149
54
Kigali-Bujumbura
396
193
171
10
Source: Fimotions (2017), data source: NTTCA and various studies.
Note: Flows are average daily traffic volumes, two directions
The transit traffic is made up of imports for more than 90%. Uganda is by far the first
destination, accounting for more than three quarters of the total transit traffic. The other
countries (Tanzania, Rwanda, Sudan, and DR Congo) lag far behind, with shares ranging
between 5 and 6%.
Trade Related Traffic
An estimate has been made of the daily volumes of road freight due to intra-regional trade and
trade also with the rest of the world. The method used was the same as for the TAH1 as
follows:
Converting the value of goods to volume of goods assuming the average value of all
traded goods was just under $ 2,000 per ton;
Applying an average load of 30 tons for international trucking in Africa;
Empty running percentage of 85% based on very high ratio of imports to exports
which is typical of Africa trade;
Railway taking just 10% of the traffic – also typical of rail share of freight traffic.
The results of this analysis is given in
Table 47.It shows that Uganda - Kenya two-way traffic
would be about 79 trucks per day, add to this Uganda/World traffic of 121 trucks per day
making a total 190 trucks per day in both directions.
Table 47: Origin and destination of daily transit traffic on the Northern Corridor
Uganda
Rwanda Burundi
Kenya DRC S.
Sudan
N.
Tanzania
World
Uganda
-
19
4
34
12
21
5
79
Rwanda
1
-
1
7
15
0
0
20
Burundi
0
0
-
1
2
-
0
3
Kenya
45
12
3
-
19
18
19
95
DRC
0
1
3
0
-
-
0
4
S. Sudan
0
0
-
1
-
-
-
1
N. Tanzania
5
3
4
64
16
0
-
75
World
42
29
11
89
53
33
20
-
Source: Fimotions (2017).


