
Improving Transnational Transport Corridors
In the OIC Member Countries: Concepts and Cases
144
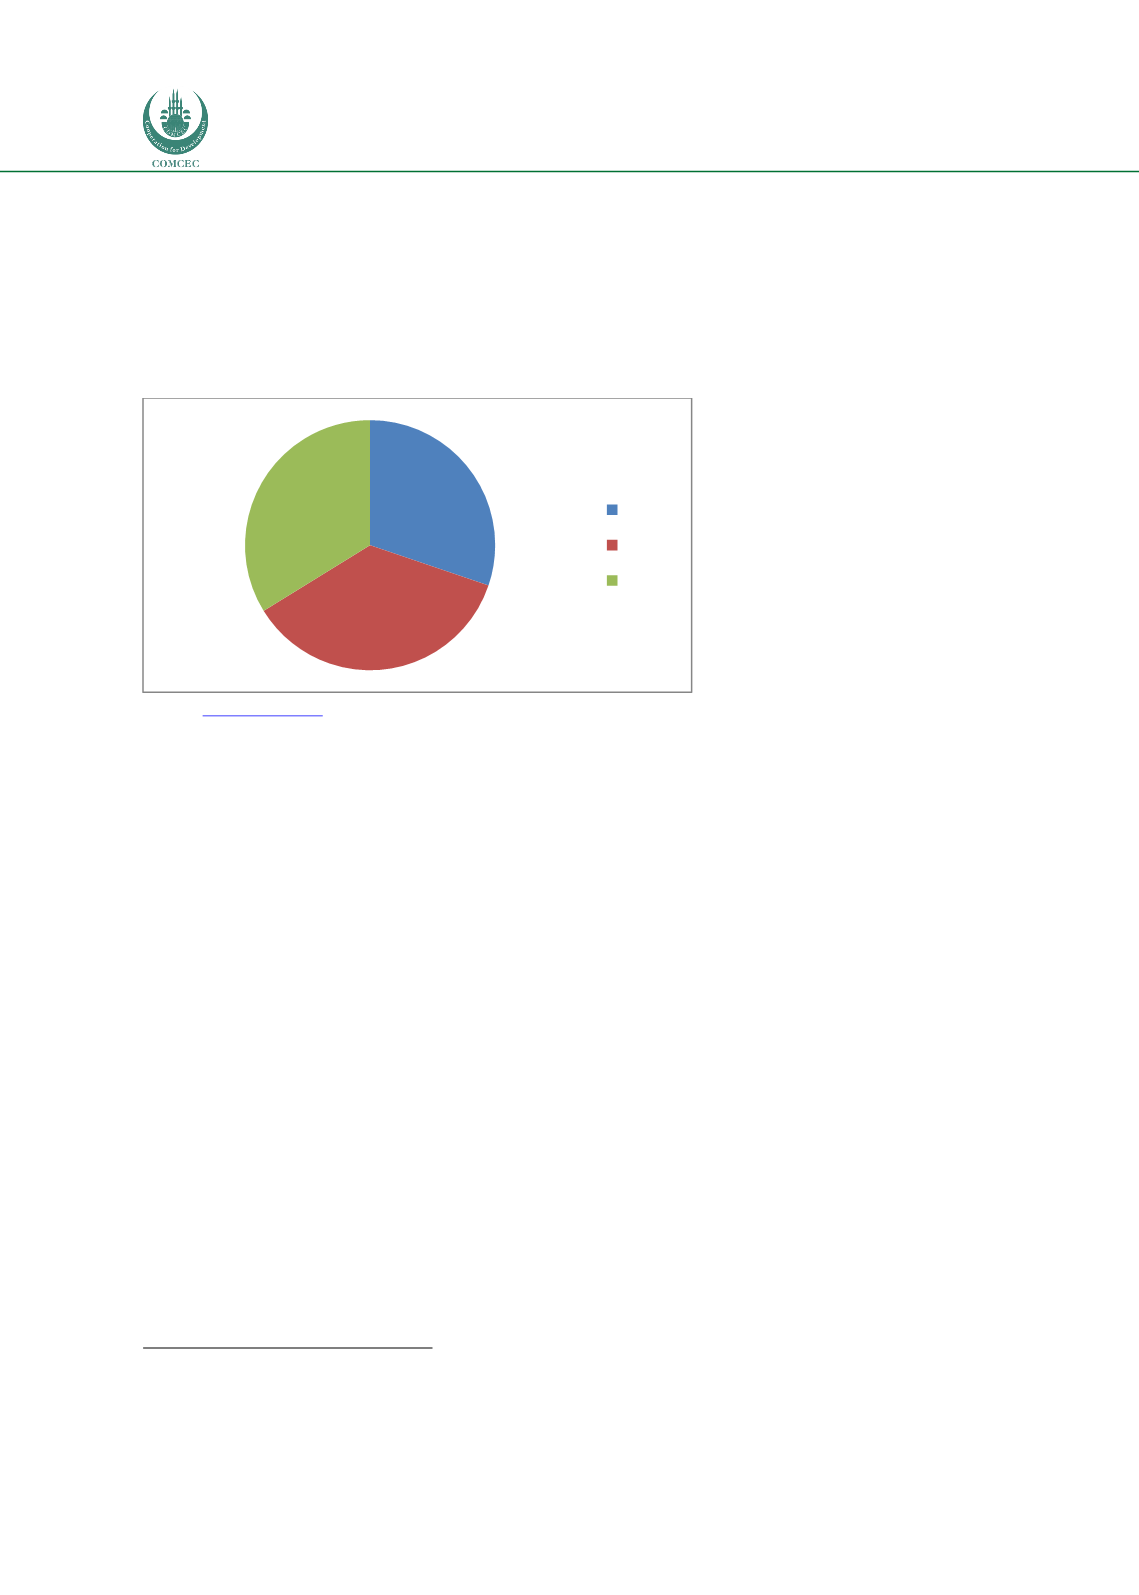
Road Condition
The road condition data of 2016 used in the latest monitoring report of the Authority discloses
that only 34% of corridor network of roads can be said to be in good condition as shown in
Figure 49.It is well known that vehicle operating costs vary with road condition, so it will be
incumbent on policy makers to address this issue.
Figure 49: Northern Corridor road condition status in 2016
Source
: www.ttcanc.org and Fimotions.
Road Side Services
are a vital feature of the road network that supports the overall goals of
the corridor. A network of serviced stops that at planned to common standards is aimed to
enhance the travelling experience as well as improve road safety. A report details the locations
and levels of services in each of the participation countries
72
.
Border Crossing and Port Handling
times still constitute a substantial part of the overall
transit time by both rail and road though they have improved. The main border crossings and
time to clear BCPs can be found i
n Figure 46.The Malaba border between Uganda and Kenya is by far the busiest border with traffic in 2013
accounting for 85% of all corridor traffic. The data showed that the average number of trucks
in the outbound direction to average 631 trucks and inbound to be 469 trucks. The reasons for
the difference between the two are that inbound conveys imported goods while outbound
traffic is mostly empty vehicles as explained. The processing exigencies for imports are more
exacting and truckers will seek longer routes to avoid various on-costs. The border operates
24 hours, but trucking companies usually do not allow nighttime driving. Usage of the border,
records showed that 75%of the trucks arrived between 7:00am and 9:00pm, 15%between
9:00pm and 11:00pm, and only 10%between 11:00pm and 7:00am. Border processing times
have improved substantially at Malaba due to the implementation of a program of support.
Processing times have fallen from 48 hours in 2009 to 20 hours in 2012, 6 hours in 2015 but
7
2 http://www.roadsidestations.org/wp-content/uploads/2014/10/Final-Report-1STVOLUMEed3.pdf30%
36%
34%
Poor
Fair
Good


