
Improving Transnational Transport Corridors
In the OIC Member Countries: Concepts and Cases
145
worsened to 9.5 hours in 2017 due to technical issues with the OSBP. There is little difference
between processing times between containerized and bulk goods.
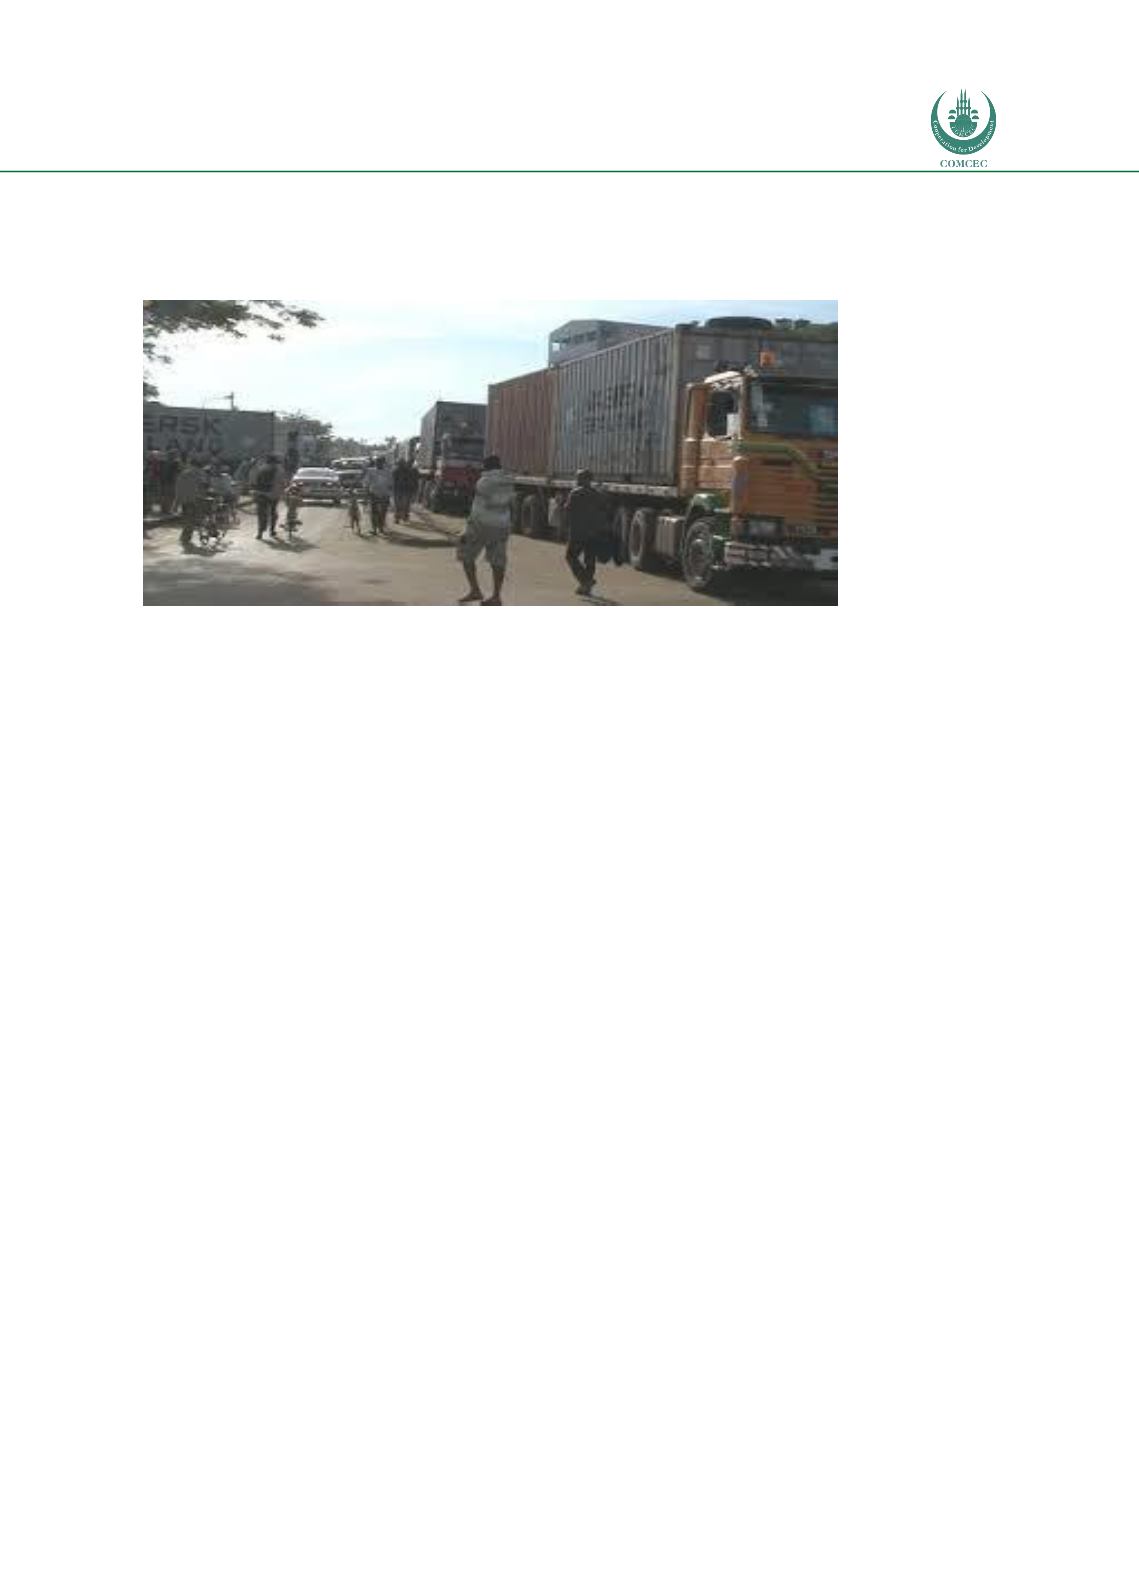
Figure 50: Queuing traffic at the Malaba border post
Source
: Abeingo Community Network INGONEWS Service.Mombasa Port
Mombasa Port is the main gateway port for the Corridor. Since 2012, cargo throughput has
registered a steady annual growth of 5.7% from 21.92 million tons to 27.36 million tons in
2016. Similarly, container traffic has registered an impressive growth from 903,463 TEUs in
2012 to 1,091,371 TEUs over the last five years. Transit traffic recorded 4% growth to 7.75
million tons in 2016 up from 6.63 million tons in 2012. This growth was mainly supported by
Uganda t
ransit traffic
, which grew by 7.1% over the same period. Economic growth in the
Northern Corridor Region contributed significantly to the increased cargo throughput at the
Port of Mombasa. In 2016, total cargo throughput recorded was 27.36 million tons against
26.73 million tons registered in 2015. This represented a 2.4% growth. It is important to
record that the dwell time for containers in the Port was around 70 hours. Dwell time is the
time taken from the container being unloaded from the ship to be transported from the Port. In
2015 the dwell time was 95 hours and in 2015 it was 115 hours, so a very good improvement
can be seen. This is due to more integrated port management and operations and smarter
customs clearance procedures.
To improve the cargo throughput of the Port, a new container terminal with an annual capacity
of 550,000 TEUs per year was commissioned in 2016. The share of Port Traffic to each NTTA
member (excluding Kenya) is presented i
n Figure 51.Uganda accounts for 78% of the transit
traffic. The reason for this is historic. Uganda and Kenya were the main members of the East
African Community and Mombasa Port was always used by Land Locked Uganda.


