
Special Economic Zones in the OIC Region:
Learning from Experience
47
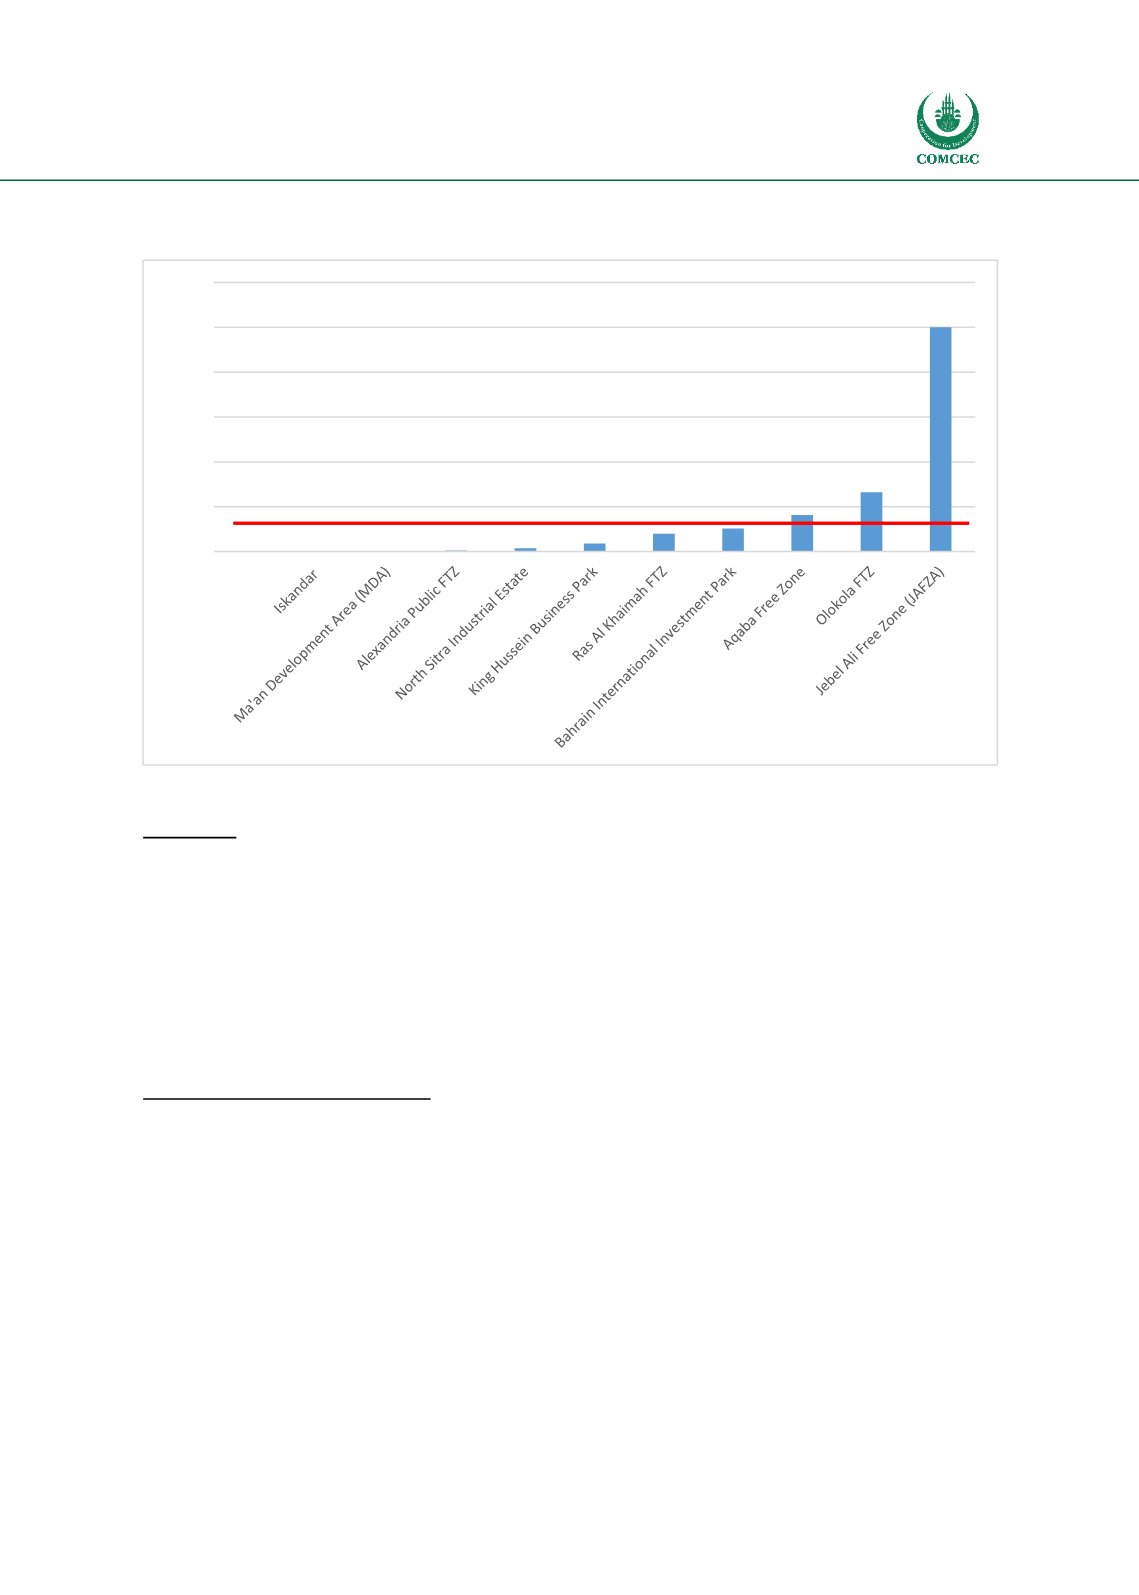
Figure 8 – Capacity of Airports in Proximity to Selected OIC Member SEZs (000 tonnes per
annum (TPA))
Source: BuroHappold Analysis 2017
Summary
The above analysis indicates that some of the SEZs selected for benchmarking have very good
access to strategic infrastructure which has supported their development and growth. Examples
such as Jebel Ali which has excellent accessibility to both a large port and international airports
demonstrates the critical relationship between SEZ development and infrastructure
accessibility and capacity for developing successful SEZs.
4.2.2
Economic Characteristics
Employment and Enterprises
At the typology level, the two key indicators used for the analysis are - average number of
companies per hectare and jobs created per company. Due to incompleteness of data, the figures
presented below are based on those zones for which available, reliable data was provided.
Although not fully representative they give some indication of the trends within the different
typologies. This analysis is presented withi
n Figure 9an
d Figure 10.0
500
1,000
1,500
2,000
2,500
3,000
Average - 417,000 TPA


