


 61 / 169

Increasing the Resilience of the Food Systems
In Islamic States in Face of Future Food Crises
50
Food Production
In 2013, the Food Production Index (FPI) of OIC countries, on an aggregate level, remained
higher than the world average, registering an increase of 26% compared to 2005. The FPI
measures the production of food crops that are edible and nutrient; items such as tea and coffee
are excluded for their lack of nutritive value. However, the food production per capita index of
the OIC in 2013 was 109.7, which is lower than the world average.
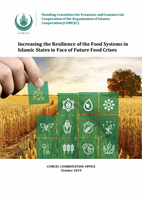
Table 24: Per Capita Food Production Index and Food Production Index
Per Capita
Food
Production
Index**
2000
2005
2006
2007
2008
2009
2010
2011
2012
2013
OIC
Average
92.1
100.3
102.7
101.7
103.8
105.2
106.4
108.4
110.3
109.7
World
Average
94.5
100
101.2
103.8
107
107
108.8
111.9
112.4
115.2
Food
Production
Index*
OIC
Average
83.9
100.2
104.6
105.5
109.8
113.2
116.7
120.2
124.4
125.8
World
Average
89.9
100.0
102.2
106.0
110.2
111.4
114.5
118.6
120.5
124.5
Source: SESRIC 2016
* Relative level of the aggregate volume of food production for each year in comparison with the base period
2004-2006
** Relative level of the per capita volume of food production for each year in comparison with the base period
2004-2006
Food Trade
OIC food exports in 2018 totaled $117.2 billion versus food imports of $184.2 billion, creating a
food-pertinent trade gap of almost $67 billion.
188
Cereal imports reached $40.5 billion,
constituting almost 22% of the total food imports.
OIC food imports from OIC member countries accounted for $34 billion, constituting only 18%
of the total food imports in 2018. This highlights the region's import dependency on non-OIC
countries. China ranked as the OIC’s top food importer, followed by India and the U.S. Brazil was
the OIC’s top food exporter, followed by the U.S. and India.
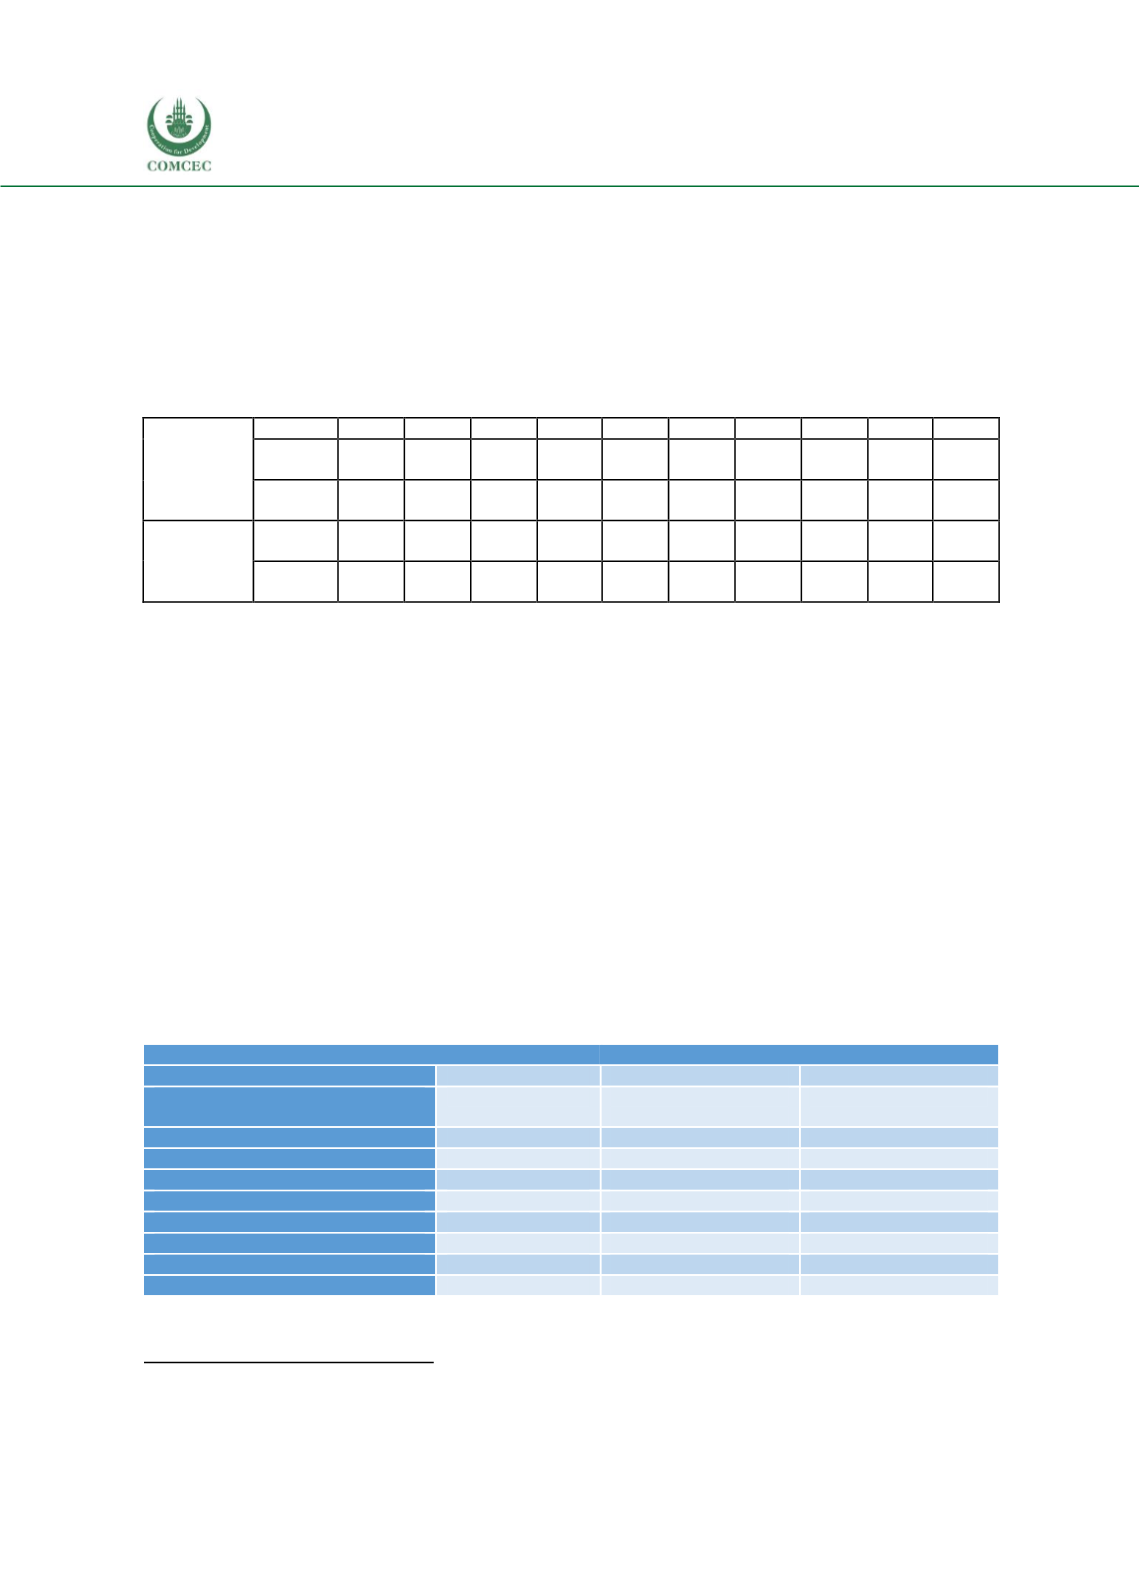
Table 25: Top Food Importers and Exporters of OIC Countries – 2018 ($ thousand)
Source: ITC - Trade map
188
ITC Trademap. Retrieved
fromhttps://www.trademap.org/Index.aspxImporting Markets
Exporting Markets
China
8,528,272
Brazil
16,558,919
India
7,942,803
United States of
America
14,672,855
United States of America
7,172,141
India
13,279,214
Netherlands
5,911,846
Russian Federation
11,549,702
Spain
4,255,258
China
8,564,506
Russian Federation
4,084,663
Argentina
8,451,940
Singapore
3,345,200
Indonesia
7,460,554
Italy
3,331,530
Thailand
6,946,927
Germany
3,249,471
France
6,927,573
Iraq
3,195,920
Ukraine
6,808,515