
Increasing the Resilience of the Food Systems
In Islamic States in Face of Future Food Crises
52
Table 26: Criteria for Segmentation of OIC Countries
Groups
Criteria
Group A (A1
and A2)
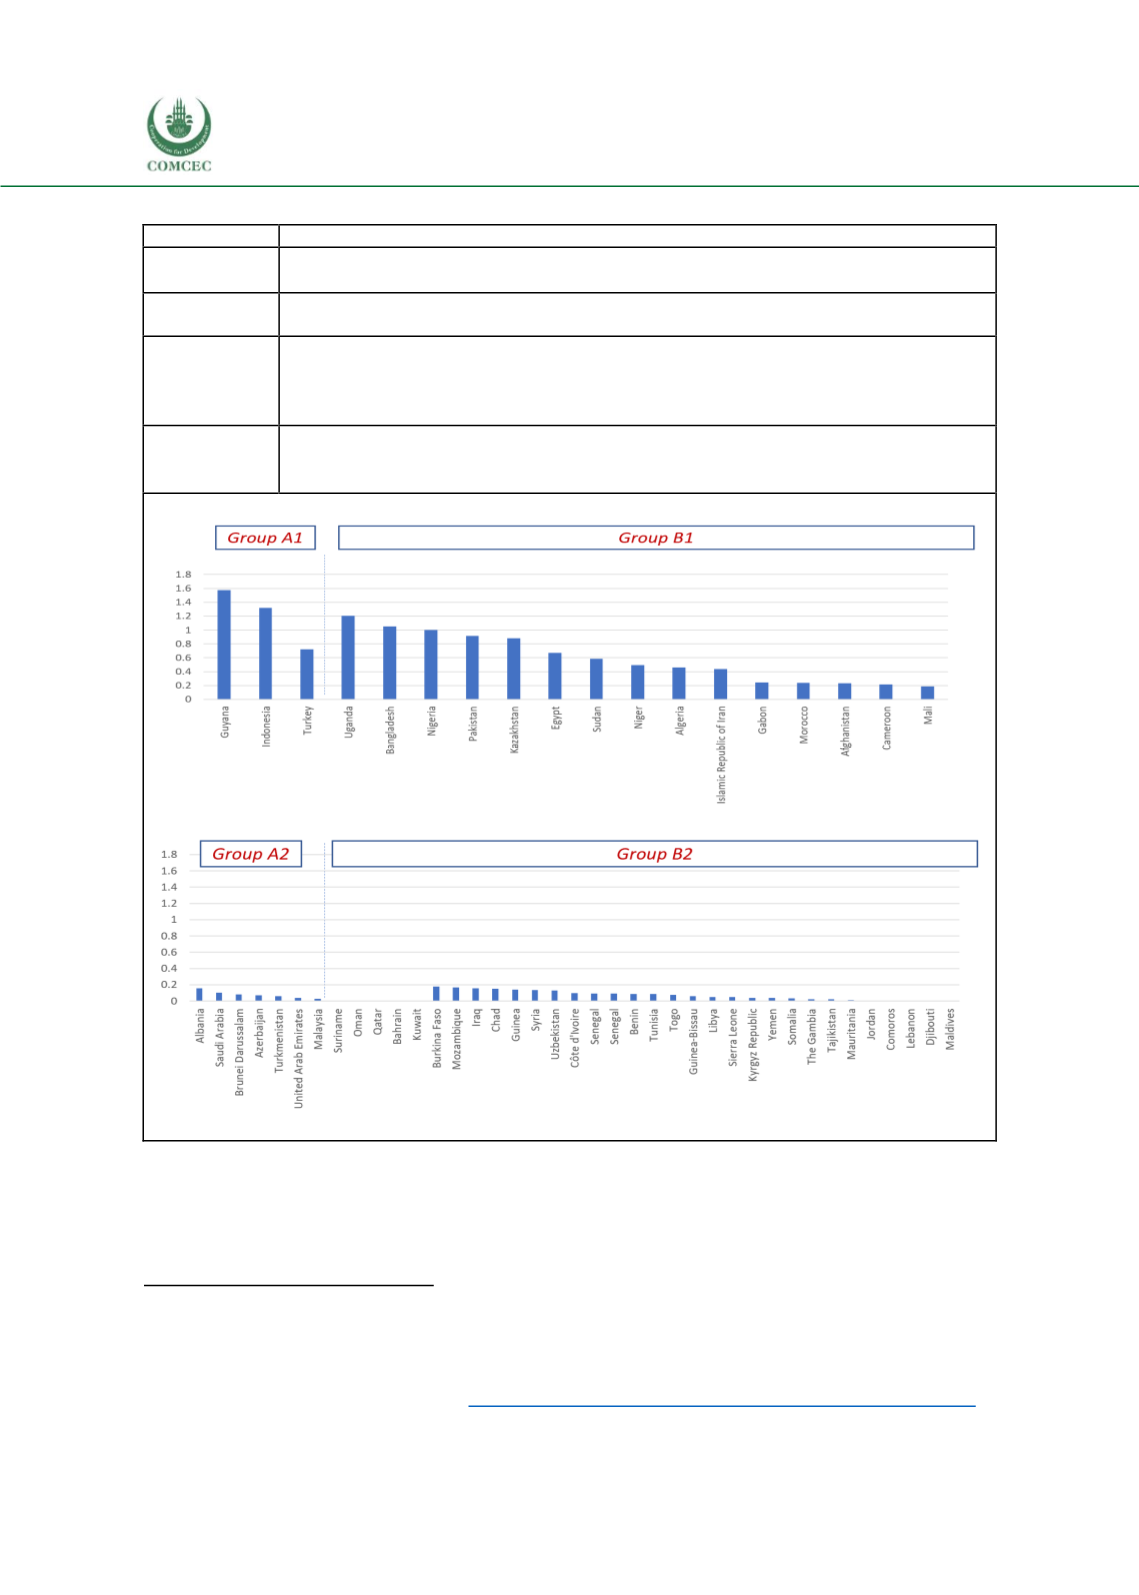
Countries that have robust agricultural capacity, scoring more than 0.18 on the
production index prepared for this study
189
Group B (B1
and B2)
Countries that have scored below 0.18 on the production index
Group 1 (A1
and B1)
Countries that are (a) not low-income food deficit countries and (b) that meet one of the
following additional criteria: (i) Malnutrition falls below of 7.7% of the adult population
or (ii) either GDP per capita exceeds $4,000, or there is a positive trade balance on food
products
Group 2 (A2
and B2)
Countries that meet either of the following criteria: (a) They are classified as low-income
food deficit countries or (b) They have malnutrition that falls above 7.7% of the
population; or (c) their GDP per capital falls below $4,000 per annum
Figure 14: Agricultural Capacity Index (maximum score of 3)
Source: UN FAOSTAT
190
; UN AQUASTAT
191
; DinarStandard analysis and synthesis
192
189
Index is based on how OIC countries compare on Total renewablewater resourcesper capita (m3/inhab/year), Arable
land (000 hectares), and% share of employment in the agriculture sector. For each metric, OICmember countrieswere
given relative scores ranging from zero to one. Relative scores for each metric were added together to determine the total
index score for food production per country.
190
FAO Online Database.
www.fao.org/faostat/en/191
Add reference AQUASTAT Online Databas
e. http://www.fao.org/nr/water/aquastat/data/query/index.html?lang=en192
https://www.dinarstandard.com/


