
Increasing the Resilience of the Food Systems
In Islamic States in Face of Future Food Crises
27
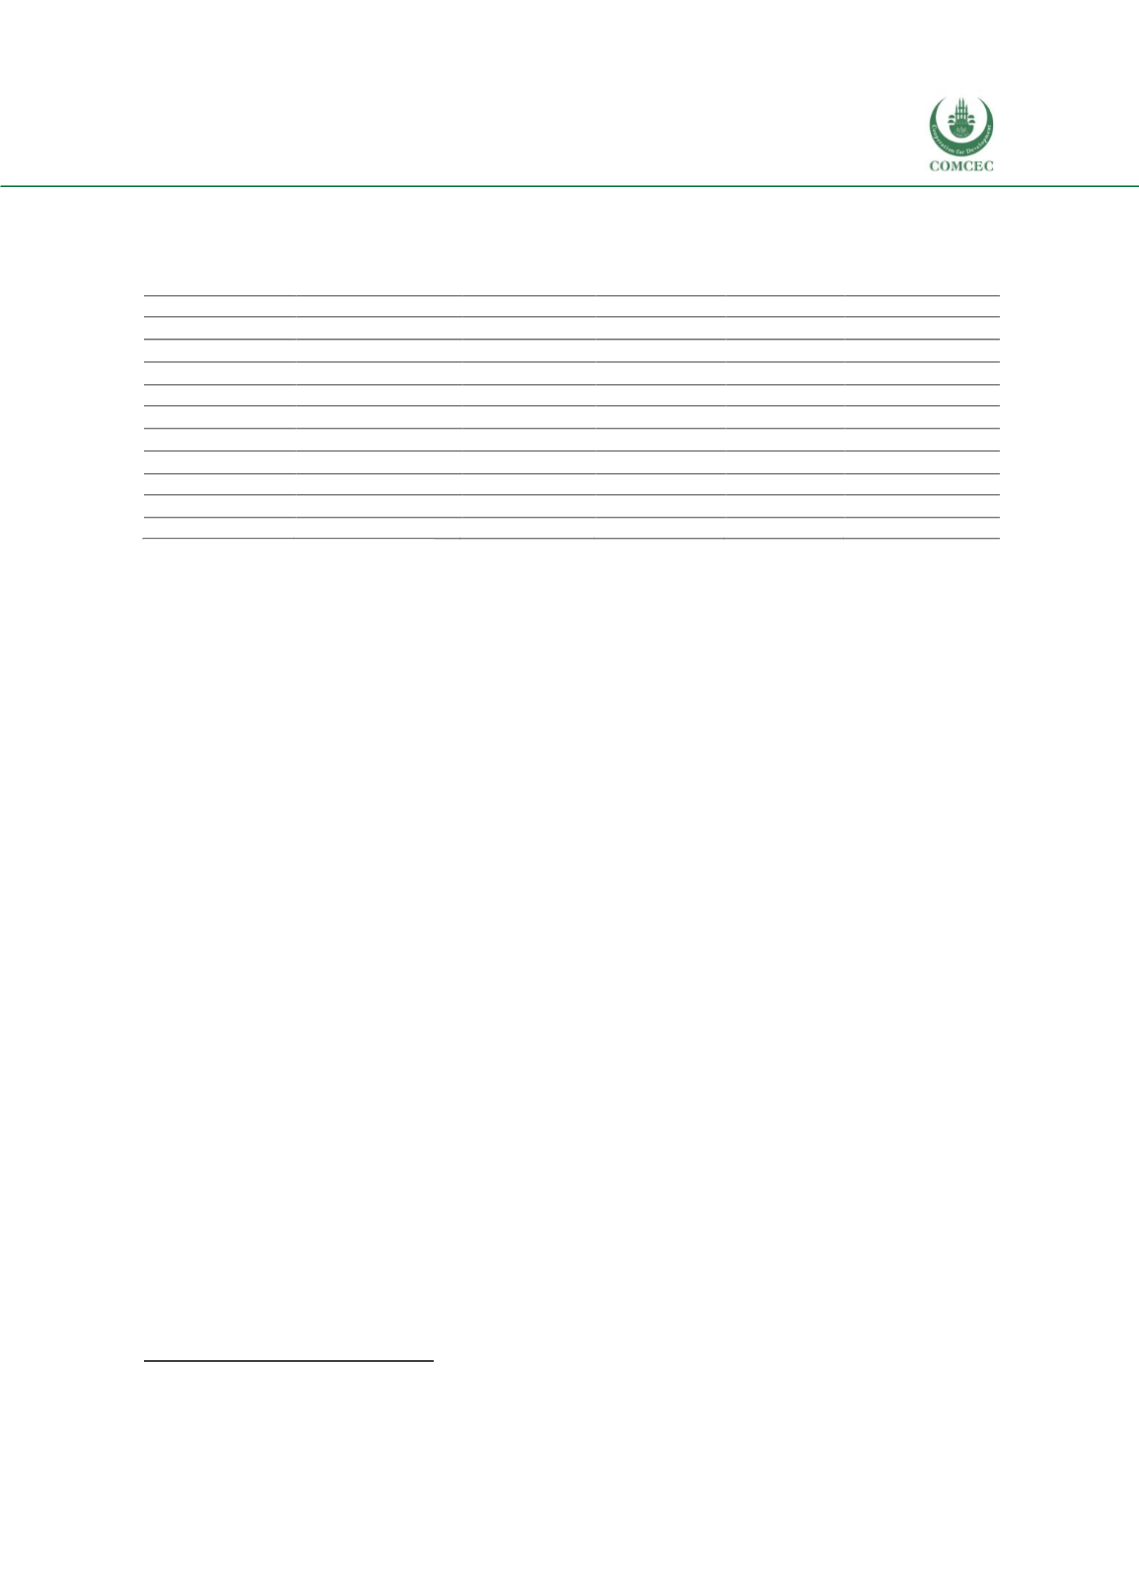
note, as the table below shows, that affordability and quality and safety scores of all lowest
performing countries are consistently lower than their availability scores
.
70
Table 6: Global Food Security Index - Lowest Performing Countries
Global Ranking
Country
Overall score Affordability Availability
Quality & Safety
=104
Niger
33.7
22.5
45.1
30.2
=104
Zambia
33.7
19.9
48.7
27.0
106
Haiti
33.0
28.0
39.6
27.5
107
Malawi
32.4
18.0
44.7
34.8
108
Chad
31.5
22.3
38.6
35.2
109
Sierra Leone
29.2
21.8
35.9
29.0
110
Yemen
28.5
29.0
31.0
20.3
111
Madagascar
27.0
12.4
42.0
22.5
112
Congo (Dem. Rep.)
26.1
14.3
36.1
28.3
113
Burundi
23.9
14.7
30.0
30.6
Source: The Global Food Security Index
2.2.
Food Insecurity Drivers – Global Overview
Various food insecurity drivers—whether economic, political, social or environmental—contribute
to varying degrees to the rise of global
hunger.Inthis section,the naturalresources and resilience
scores of the Global Food Security index are used to provide a global overview of vulnerability to
food insecurity drivers. The natural resources and resilience category includes six components:
exposure, water,land, oceans, adaptivecapacity, anddemographic stress.The exposure component
relates toenvironmental drivers, which covers temperature rise,drought,flooding, stormseverity,
sea level rise, and commitment to managing exposure. The water, land and oceans components
relate to economic insecurity drivers, which covers the availability/scarcity of natural resources
needed for food security—which includes agricultural water quantity and quality, soil erosion,
grassland, forest change, eutrophication and hypoxia, marine biodiversity, and marine protected
areas. The sensitivity component relates to both economic and political insecurity drivers, which
cover food import dependency, dependence on natural capital,and disasterriskmanagement. The
adaptive capacity componentrelates topolitical drivers, which cover earlywarningmeasures and
a national agricultural risk management system. The demographic stresses component relates to
social insecurity drivers, which covers urbanization and population growth.
In the following graph,scores from thenatural resources and resilience category of the GlobalFood
Security index illustrate regionaldifferences in vulnerability to food insecurity drivers. Europehas
the best performance on exposure,land,demographic stresses and adaptive capacity. Sub-Saharan
Africa has the bestperformance on land,water,andoceans, dueto thecomparatively non-industrial
nature of its agriculture and infrastructure.NorthAmerica has the best performance on sensitivity,
whichwhere all regions aremost vulnerable due to food import dependency. TheMiddle Eastand
North Africa—especially the Gulf Cooperation Council (GCC) countries—are highly dependenton
imports for their food supplies. However, as only a small proportion of GCC populations live
below the poverty line, they are more financially resilient when global prices spike than Sub-
Saharan African countries, which are also highly dependent on imports but have also high
percentage of their populations below the poverty line.
71
70
The Economist Intelligence Unit. (2018). Global Food Security Index 2018: Building Resilience in the Face of Rising Food-
Security Risks. Retrieved
fromhttps://foodsecurityindex.eiu.com/71
Analysis based on Global Food Security Index scores.


