


 25 / 102

Increasing Agricultural Productivity:
Encouraging Foreign Direct Investments in the COMCEC Region
15
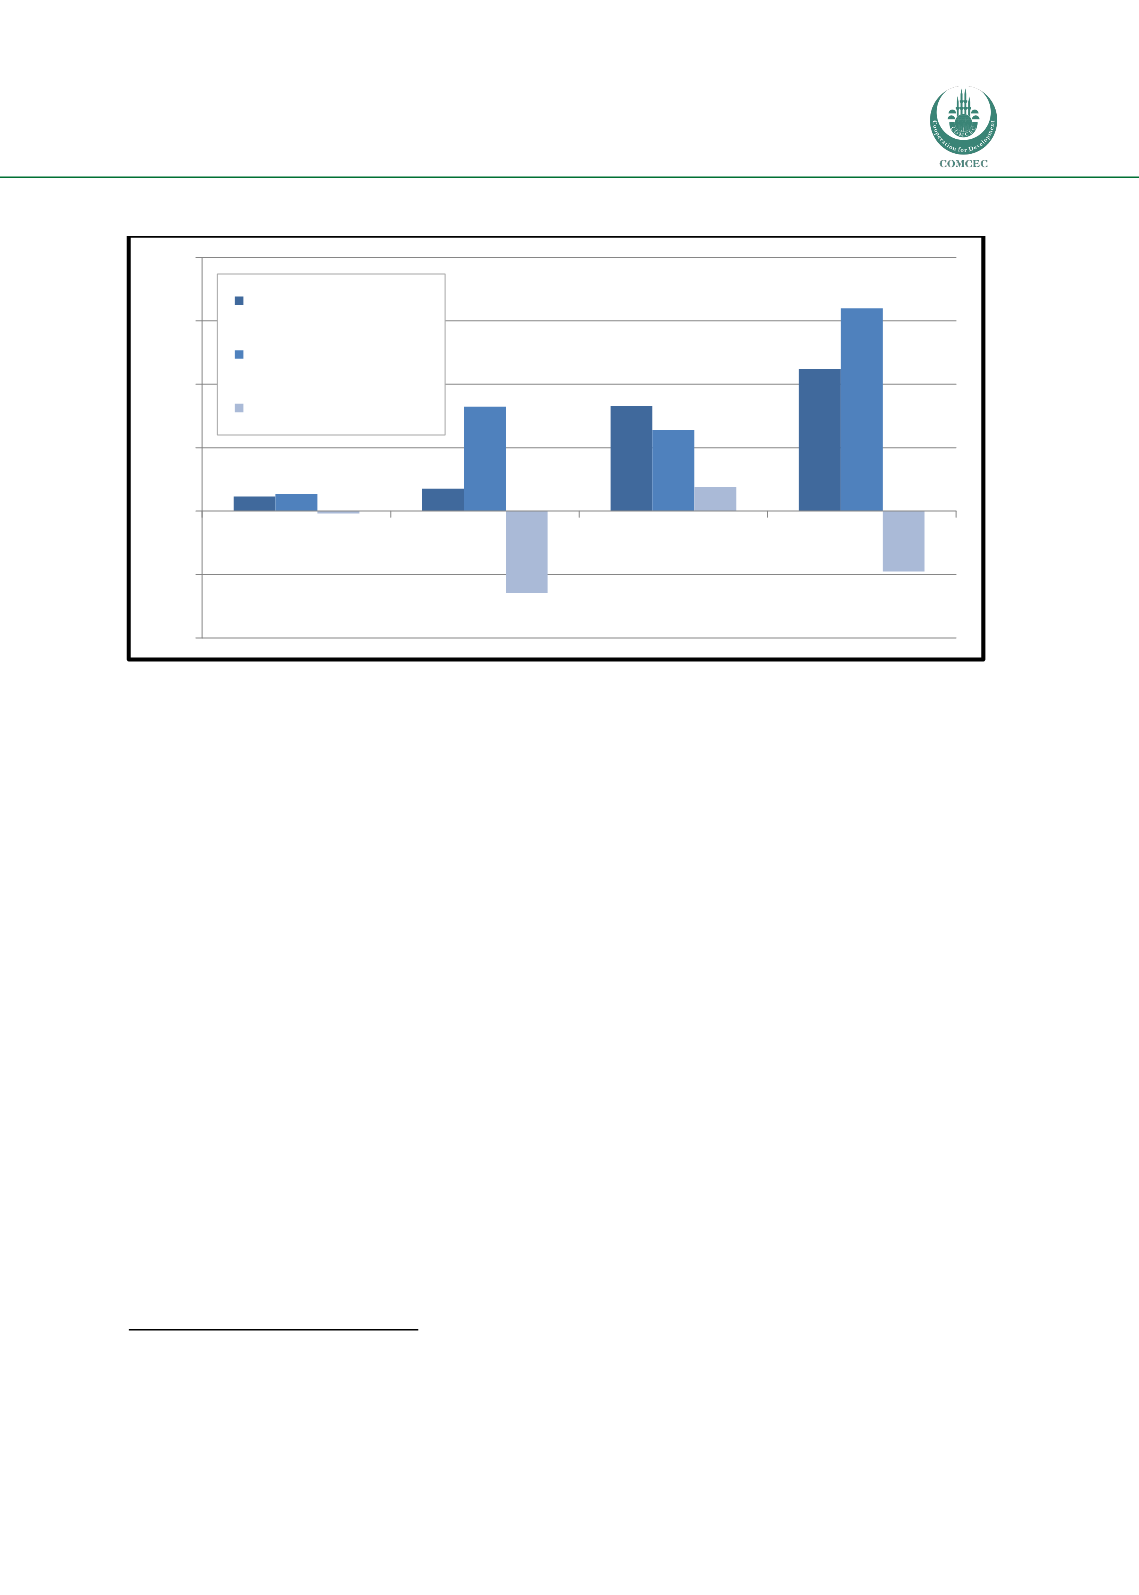
Figure 7: Agricultural Trade Balance in the Sub-Regions of the COMCEC (2012)
Source:
Calculated by using the FAO online database (FAOSTAT), 2013; (Geographical classification can be found in Annex
1)
At the individual country level, the majority of the export volume of agricultural products of
the COMCEC Region was realized by just a very few Member Countries, namely Indonesia,
Malaysia, Turkey, Cote d’Ivoire and Iran. Together these countries account for little over 70
percent of the COMCEC’s total agricultural commodity exports.
20
The lack of capacity to increase
productivity in the short term (in terms of harvesting higher yields per hectare) as well as
difficult climate conditions for agricultural production in particularly the Arab COMCEC Member
Countries results in an overall import dependency.
1.7
Importance of Agriculture in Ending Hunger
Sufficient and sustainable food production is amongst the top priorities of each government, yet,
too many examples of undernourishment remind us of the continuing challenge. In order to lead
an active and healthy life, people need an intake of at least 1,700-2,000 calories a day. At
present, one sixth of the world’s population does not have access to this required amount.
21
A
large majority of these people (up to 70 percent) live in rural areas.
The Hunger Map 2012 shows that the biggest challenges are found in Sub-Saharan COMCEC
Member Countries. In Mozambique more than 35 percent of the population is undernourished,
while at least a quarter of the population in countries such as Chad, Uganda, and Tajikistan have
difficulties securing sufficient food. Moreover, 35 COMCEC Member Countries are classified as
Low-Income Food Deficit Countries (LIFDCs), of which 21 countries are classified as “Countries
in Crisis Requiring External Assistance”.
22
Picture 2: Percentage Population Undernourished World Map
20
COMCEC, 2013.
21
FAO, 2012a.
22
FAO, 2013.
11,5
17,7
82,9
112,1
13,5
82,4
63,9
159,9
-2
-64,7
19,0
-47,8
-100
-50
0
50
100
150
200
African Group
Arab Group
Asian Group
OIC
Export (in bn USD)
Import (in bn USD)
Trade Balance (in bn USD)