
Increasing Agricultural Productivity:
Encouraging Foreign Direct Investments in the COMCEC Region
10
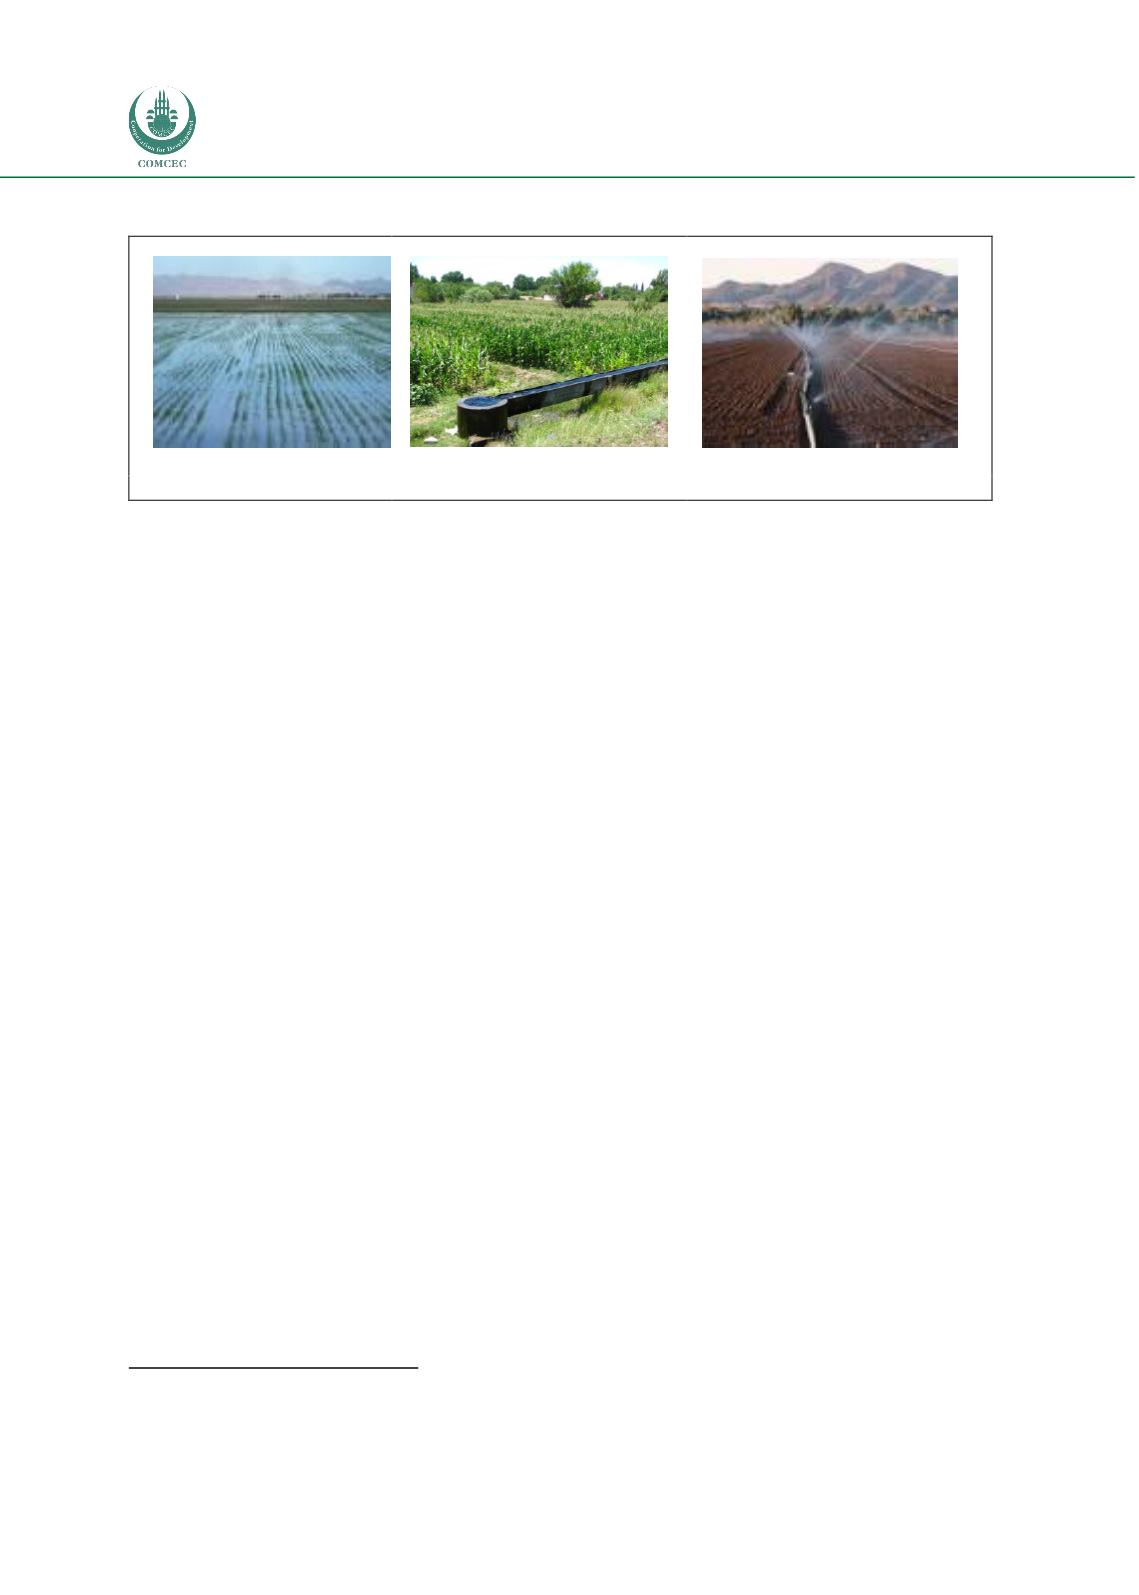
Picture 1 Overview of different Irrigation Techniques
Surface irrigation
Localized irrigation
Sprinkler irrigation
It sounds contradictory that in a region suffering water scarcity, 93
percent
(from 91
percent
in 2008) of irrigation still happens through surface irrigation techniques whereas only 2
percent
happens through localized irrigation and 5
percent
with sprinkler irrigation. While 27
percent
of the total arable land in the COMCEC Region is in some form equipped with irrigation,
this ratio was lower than 5
percent
in 22 COMCEC Member Countries.
To promote cooperation and growth among the COMCEC Member Countries, and spur (foreign)
investment, one recommendation is to incentivize specific investments in water-saving
irrigation equipment. The rationale behind this economic incentive is to save on water usage,
and secondly, to encourage investment and increase agricultural productivity.
1.4
Fertilizers and Machinery
Fertilizer consumption measures the quantity of plant nutrients used per unit of arable land and
stimulates the production of agricultural products. The use of fertilizer products such as
nitrogenous, potash, and phosphate fertilizers increased significantly over the past decades and
is considered an indispensable requirement in modern day agricultural production. On average
less than 80 kilograms of fertilizers per hectare of arable land were used in the COMCEC
Member Countries, compared to almost 140 kilograms in the rest of the world. The trend
analysis indicates that this gap is only widening in the next years (see Figure 4). On the other
hand, in terms of tractor use per hectare of arable land, COMCEC Member Countries perform
relatively weakly, with 1 tractor for each 100 hectares, compared to a global average of one for
each 48 hectares.
16
These figures show that agricultural input use in the COMCEC Region is far
behind the world’s overall averages.
16
FAO Databases 2013


