


 22 / 102

Increasing Agricultural Productivity:
Encouraging Foreign Direct Investments in the COMCEC Region
12
Table 4: Maize Yield Figures Between Sub-Saharan Countries and European Countries (2007)
COMCEC Member Countries and Non-COMCEC Countries in
Sub-Saharan Africa
Europe
Country
Yield (kg/ha)
Country
Yield
(kg/ha)
Ethiopia
2,725 Austria
9,105
Guinea-Bissau
2,370 Germany
9,085
Somalia
421 Slovakia
4,275
Botswana
214 Romania
1,740
Average
1,432 Average
6,051
Data Source: Gapminder Agriculture
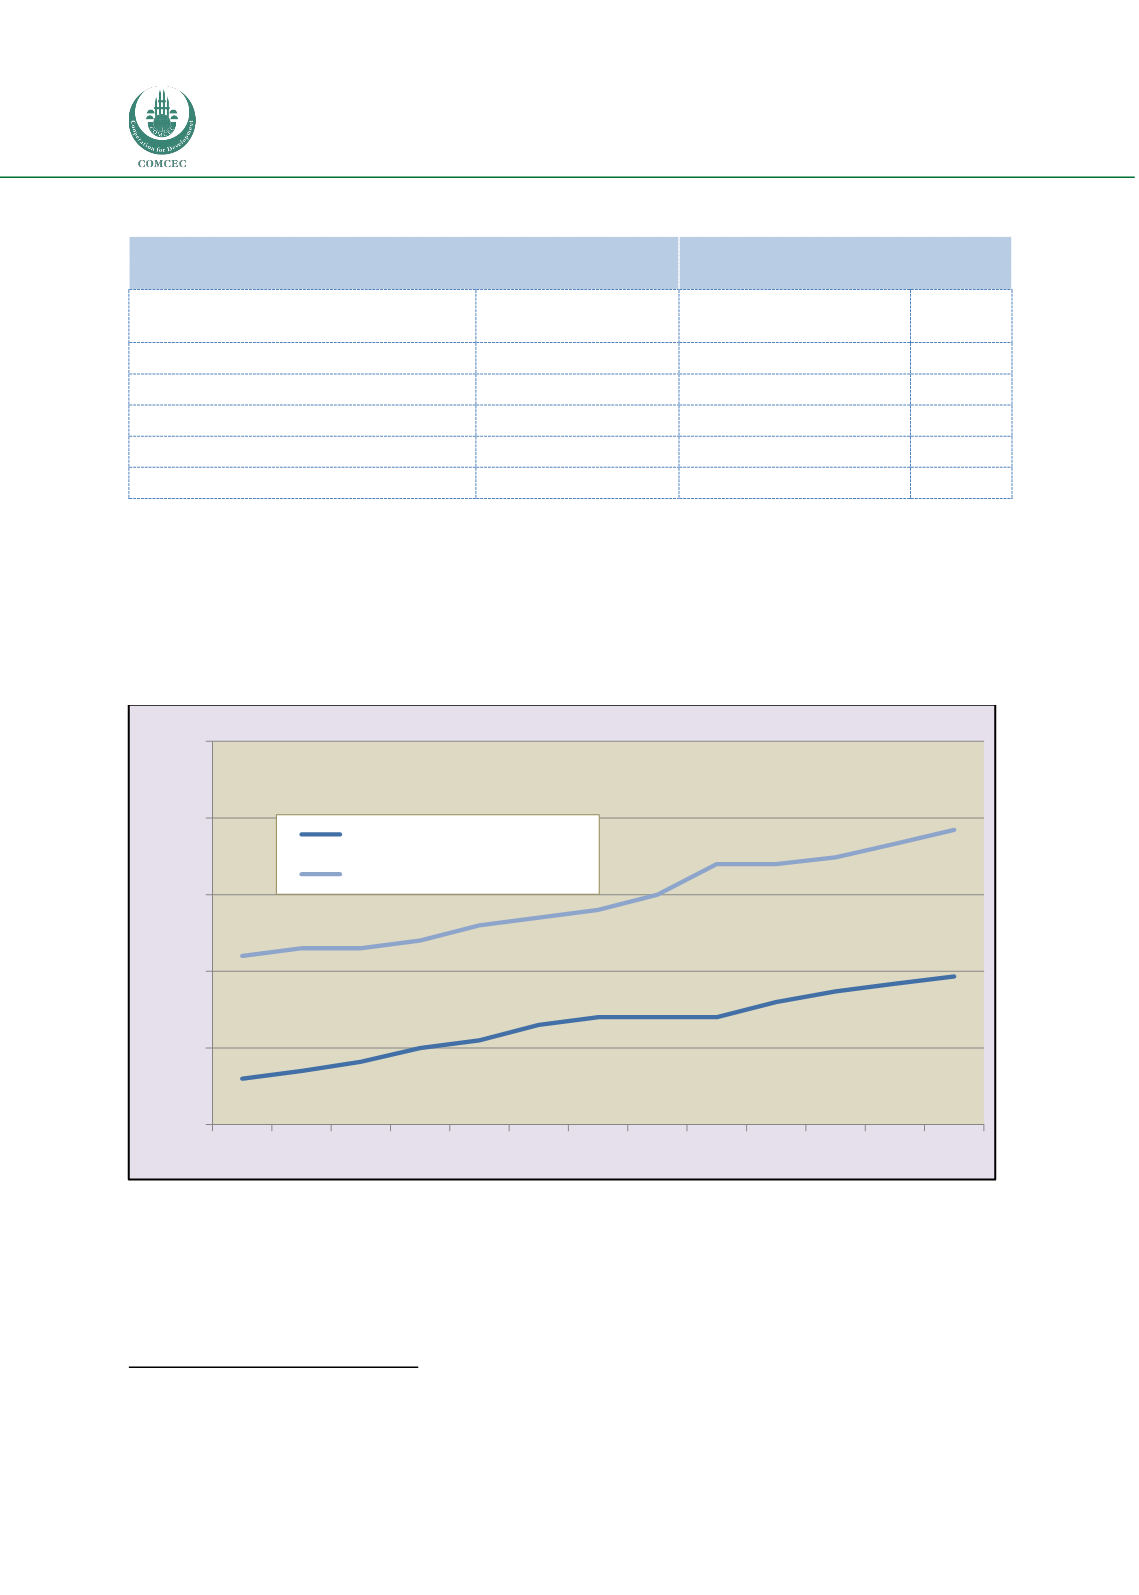
The COMCEC Member Countries show a comparable figure to the developing countries. On a
global scale, agricultural productivity in the COMCEC Member Countries remains behind global
averages. Based on actual productivity figures between 2000 and 2009, and extrapolated to
2012, the yield is 1 ton per hectare less than global averages (Figure 5).
Figure 5: Agricultural Land Productivity in the COMCEC Region and the World (2000–2012)
17
Source: Author’s own calculations based on SESRIC database.
Regarding the agricultural GDP at the sub-regional level, as presented in Figure 6, Asian Group
had the highest amount of with 367 billion US Dollars in 2011. It was followed by Arab Group
and African Group with almost 128 billion and 122 billion US Dollars, respectively. This Figure
17
Datas are based on the maize yilds.
1,5
2
2,5
3
3,5
4
2000
2002
2004
2006
2008
2010
2012
Production per heactare (tons)
COMCEC Member Countries
World