


 16 / 102

Increasing Agricultural Productivity:
Encouraging Foreign Direct Investments in the COMCEC Region
6
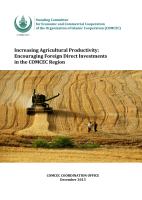
Figure 2: Size of the Agricultural Population in 2000 and 2010
.
Source: SESRIC, 2013.
A decline in agriculture’s share of employment at a faster rate than the inevitable decline in
agriculture’s share of GDP is a necessary condition for the reduction of the rural-urban gap in
living standards. In this context, migration out of agriculture is a necessary condition of healthy,
poverty-alleviating development
10
.
1.2
Land Use
The agricultural sector can only flourish if the production factors - land, capital and labour - are
sufficiently available. Available land can be used for totally different agricultural purposes and
Table 1 distinguishes three main uses of arable land: arable land, permanent crops and
permanent pasture.
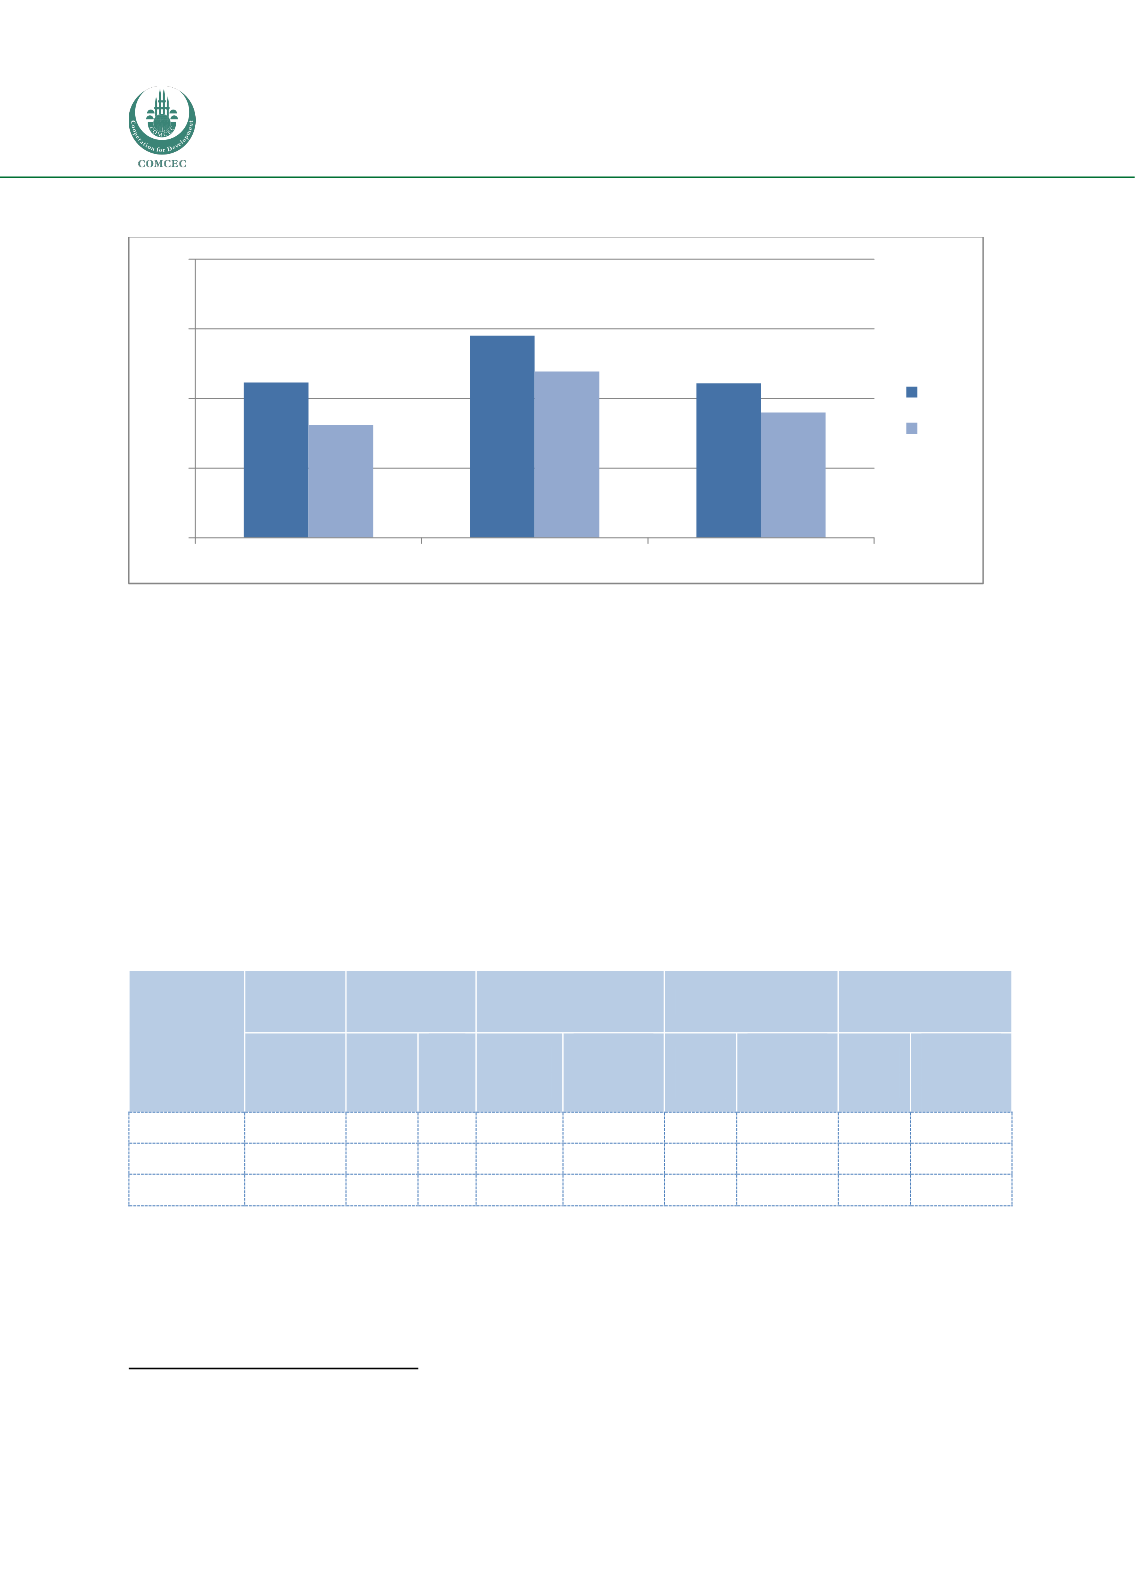
Table 1: Land Use in Agriculture (2011)
Countries
Total
Land Area
Agricultural
area
Arable Land
Permanent Crops
Permanent Pasture
Million
Hectare
Million
Hectare
% of
Land
Area
Million
hectare
% of
agricultural
area
Million
hectare
% of
agricultural
area
Million
hectare
% of
agricultural
area
COMCEC
3,129
1,392
44.5
293
20.7
55.2
3.8
1,043
75.7
Developing
9,767
4,160
38.6
942
27.1
118
3.4
3,091
69.6
World
13,003
4,911
37.6
1396
28.3
153
3.1
3,358
68.7
Source: Author’s own calculations using FAOSTAT 2013
Table 1 shows that 44.5 percent of total land area in the COMCEC Member Countries is
considered agricultural land, compared to 38.6 percent in developing countries and only 37.6
percent at world level. In absolute terms this is equal to a total amount of 1,392 million hectares.
10
IFAD, 2007.
42,3%
49,0%
42,2%
36,2%
43,9%
38,0%
20%
30%
40%
50%
60%
COMCEC Countries
Developing Countries
World
2000
2010