


 83 / 272

Reviewing Agricultural Trade Policies
To Promote Intra-OIC Agricultural Trade
71
Chapter 4: In-depth Assessment of Agricultural Trade Policies in
Selected OIC & non-OIC Countries
4.1. Turkey
Turkey is an upper middle income country with a GDP of 850.7 billion USD and 10,592 USD per
capita income in 2017 (World Bank, 2018). Turkey ranks 14
th
in GDP (PPP) and ranks 18
th
in
real growth rate among a total of 230 countries (CIA, 2018). The average rate of economic
growth in Turkey between 2010 and 2016 has been 6.5%. In 2016, Turkey’s economic growth
rate has been 2.9%, inflation rate has been 8.5% and unemployment rate has been 10.9%
(Eğilmez, 2018). The slowdown in economic growth is due to Turkey's vulnerability to capital
inflows and contraction in agricultural output, partly because of adverse weather conditions
(WTO, 2016).
Turkey has a robust agricultural sector with a 19.6% employment share of the country’s
working population in 2016. Agricultural sector accounts for 6.2% of the country’s GDP with a
value of 53.4 billion USD. A world leader in the production of dried figs, hazelnuts, sultanas,
raisins and dried apricots, Turkey is ranked 7
th
in agricultural production. The country is one of
the leading exporters of agricultural products in the Eastern Europe, Middle East, North Africa
(EMENA) region. Globally, Turkey exported 1,781 kinds of agricultural products to more than
190 countries in 2016. In 2016, Turkey is the largest country in Europe in terms of its
agricultural economy and second largest agricultural economy among the OECD countries with
an agricultural land of 25 million hectares, 5.1 million hectares of arable land, 3,076 agricultural
enterprises and 5.3 million people employed in agricultural sector.
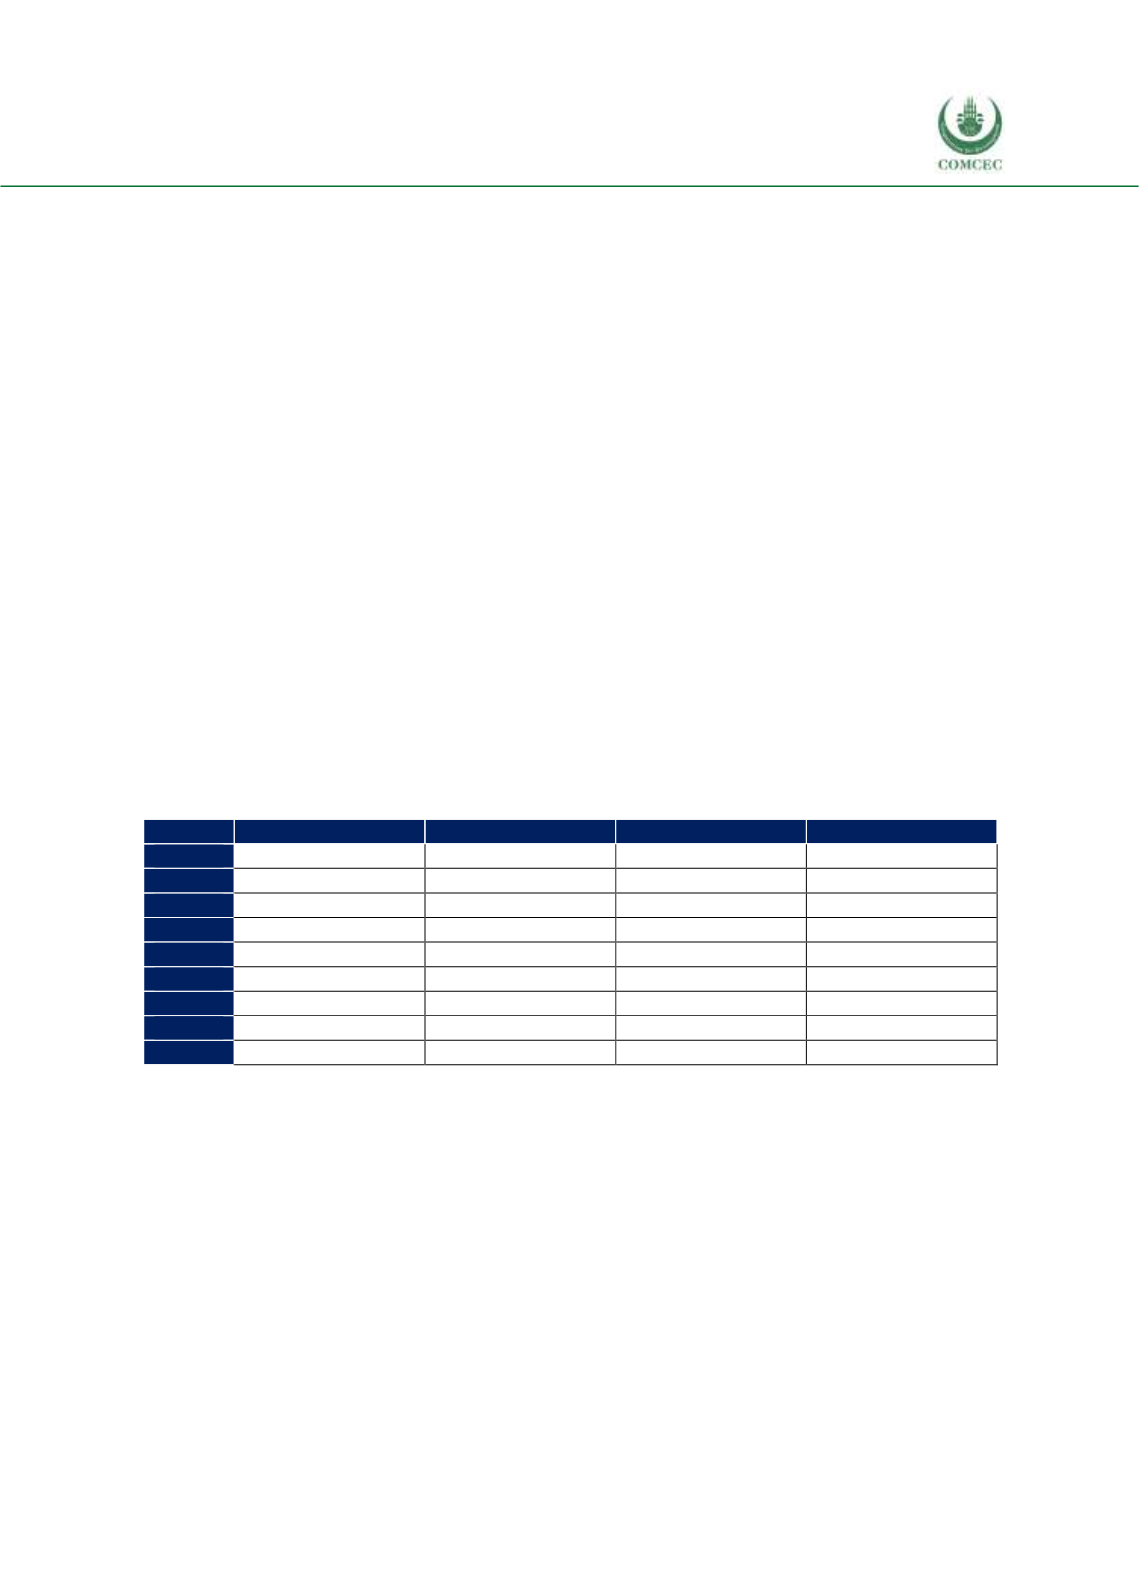
Table 4. 1 Share of Agriculture in GDP, Employment and Trade, Turkey
Year
GDP
Employment
Exports
Imports
2008
7.5
22.4
8.0
5.9
2009
8.1
23.1
10.2
6.2
2010
9.0
23.3
10.3
6.4
2011
8.2
23.3
10.7
7.2
2012
7.8
22.1
9.9
6.8
2013
6.7
21.2
11.0
6.6
2014
6.6
21.1
11.2
7.2
2015
6.9
20.6
11.4
7.4
2016
6.2
19.5
11.0
7.2
Source: CEPII BACI, Eurostat RAMON, TURKSTAT, UN Comtrade, UN Trade Statistics, and authors’
calculations
Table 4.1 presents the relative importance of agricultural sector in Turkey for the period of
2008-2016. The share of agriculture in GDP declined from 7.5% to 6.2% while the share of
agricultural sector in employment has been around 20% throughout the time period, reflecting
the significance of agriculture in maintaining the livelihoods of the people. The share of
agricultural sector in exports has been within the range of 8% to 11.4% while the share of
agricultural imports is within the range of 5.9% to 7.4%. Both export share and import share of
agricultural products show an increasing trend during the 2008-2016 period.
With its strong production and trade potential, Turkey is well placed geographically in proximity
to regional markets and has good export opportunities in Europe, Middle East and former Soviet
Union. Turkey is the top producer of hazelnuts, apricots, figs, dried raisins and cherries and top
exporter of hazelnuts, dried raisins, apricots, figs and chickpeas. In terms of trade balance in