


 57 / 272

Reviewing Agricultural Trade Policies
To Promote Intra-OIC Agricultural Trade
45
3.3.1. Measures directly affecting imports
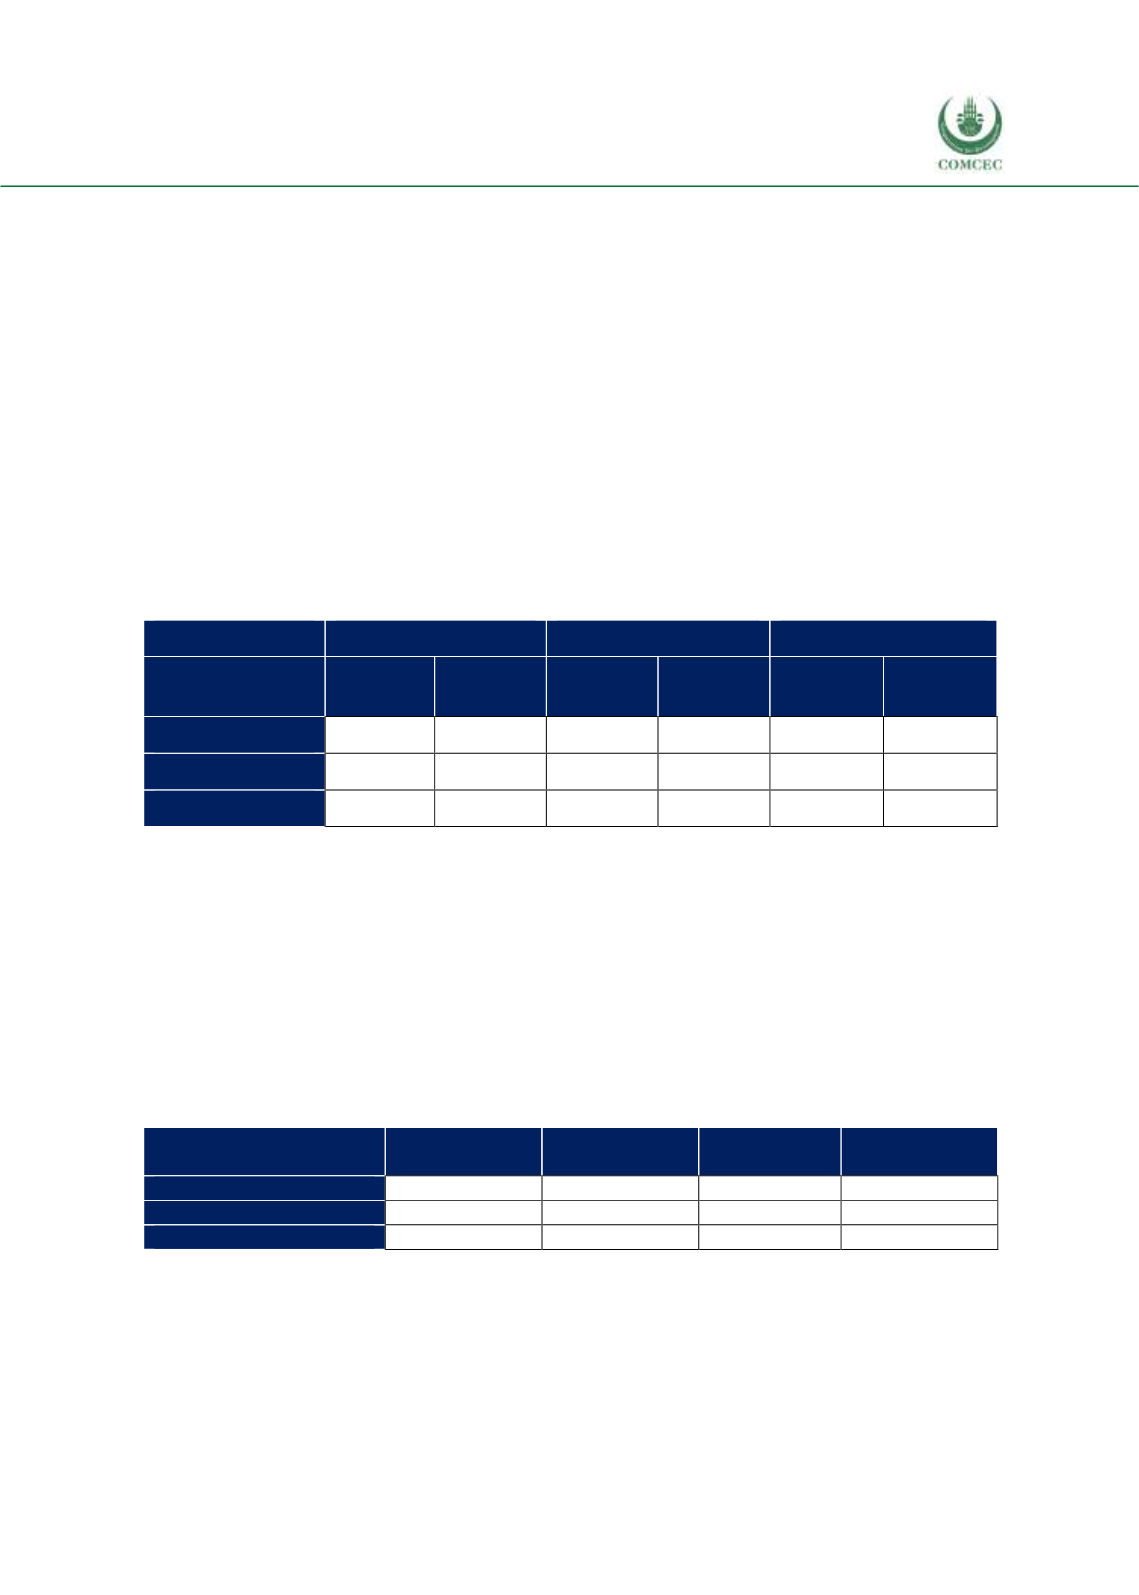
According to Table 3.1, the Arab group countries apply the lowest average tariff protection in all
three categories both to the OIC and to the non-OIC countries with the exception of agricultural
rawmaterials for which Asian group countries have lower weighted average tariffs. Considering
the low export volume of this category for the Arab group compared to their exports in
agricultural food products, this can be considered to be controversial since the lowering or total
removal of tariffs applied to the raw materials will increase the competitiveness of the food
sector. The highest protection is applied by the African group and in all three categories.
The three groups’ weighted average tariff rates are higher for non-OIC countries except in the
agricultural food products for which the African group’s average tariff rate on imports fromnon-
OIC countries is slightly lower than OIC countries. This should be resulting from preferential
trade agreements and particularly from the ones established with the European Union with
which the continent has historic economic ties. Similarly, the weighted average tariff rate for
agricultural raw materials are lower for non-OIC countries in the Asian and Arab groups.
Table 3. 1 Weighted Average Applied Tariff Rates, Ad Valorem Equivalent, %
Agri-Food
Fish
Agri-Raw
Importer
From OIC
From
non-OIC
From OIC
From
non-OIC
From OIC
From non-
OIC
African group
13.8
12.4
10.7
12.0
4.9
5.0
Asian group
10.2
12.5
4.7
6.6
1.0
0.8
Arab group
4.9
9.5
3.2
5.8
2.3
2.1
Source: ITC Macmap, CEPII BACI, Eurostat RAMON, UN Comtrade, UN Trade Statistics, and authors’
calculations
Table 3. 1 also shows that, among all three groups, the group which positively discriminates the
most intra-OIC trade is the Arab group with a weighted average tariff rate relatively much higher
for non-OIC countries for agricultural food and fish categories.
Table 3. 2 shows the last three years’ average tariff rates applied by the groups to their top 5
import products. The African group’s tariff protection is 3.1% for the imports from the same
group, 18.9% from the Asian group and 17.0% from the Arab group. However, the African
group’s average tariff rate is only 10.9% for the non-OIC countries, almost two folds of the one
applied to the Asian group.
Table 3. 2 Groups’ Average Tariff Rates for Their Top 5 Import Products, %
Importer
From African
group
From Asian
group
From Arab
group
From non-OIC
countries
African group
3.1
18.9
17.0
10.9
Asian group
1.3
7.8
13.3
11.9
Arab group
8.6
16.3
0.8
11.2
Source: ITC Macmap, CEPII BACI, Eurostat RAMON, UN Comtrade, UN Trade Statistics, and authors’
calculations. Note: Top 5 products in 3-year average between 2014 and 2016, applied tariff rates, ad
valorem equivalent.
Although using the weighted average for a group of countries covers too many details and it is
difficult to deduce concrete policy proposals, it is however certain that the existing preferential
trade agreements and Free Trade Areas (FTAs) between some African countries with non-OIC