


 58 / 272

Reviewing Agricultural Trade Policies
To Promote Intra-OIC Agricultural Trade
46
countries and especially developed countries such as USA and EU members, may result in trade
diversion due to the higher tariffs to the OIC member countries from the Asia or Arab groups.
The Asian group’s average tariff applied to its top 5 imports is 7.8% for imports from the same
group, 1.3% for imports from the African group and 13.3% from the Arab group. This means a
more preferential rate is applied to the African group, and the highest rate applied to its top 5
imports by any group is the Asian one. Here again the tariff rate applied to non-OIC is lower
(11.9%) than the one applied to the Arab group and thus has a potential to divert trade from
Arab countries to outside of the OIC.
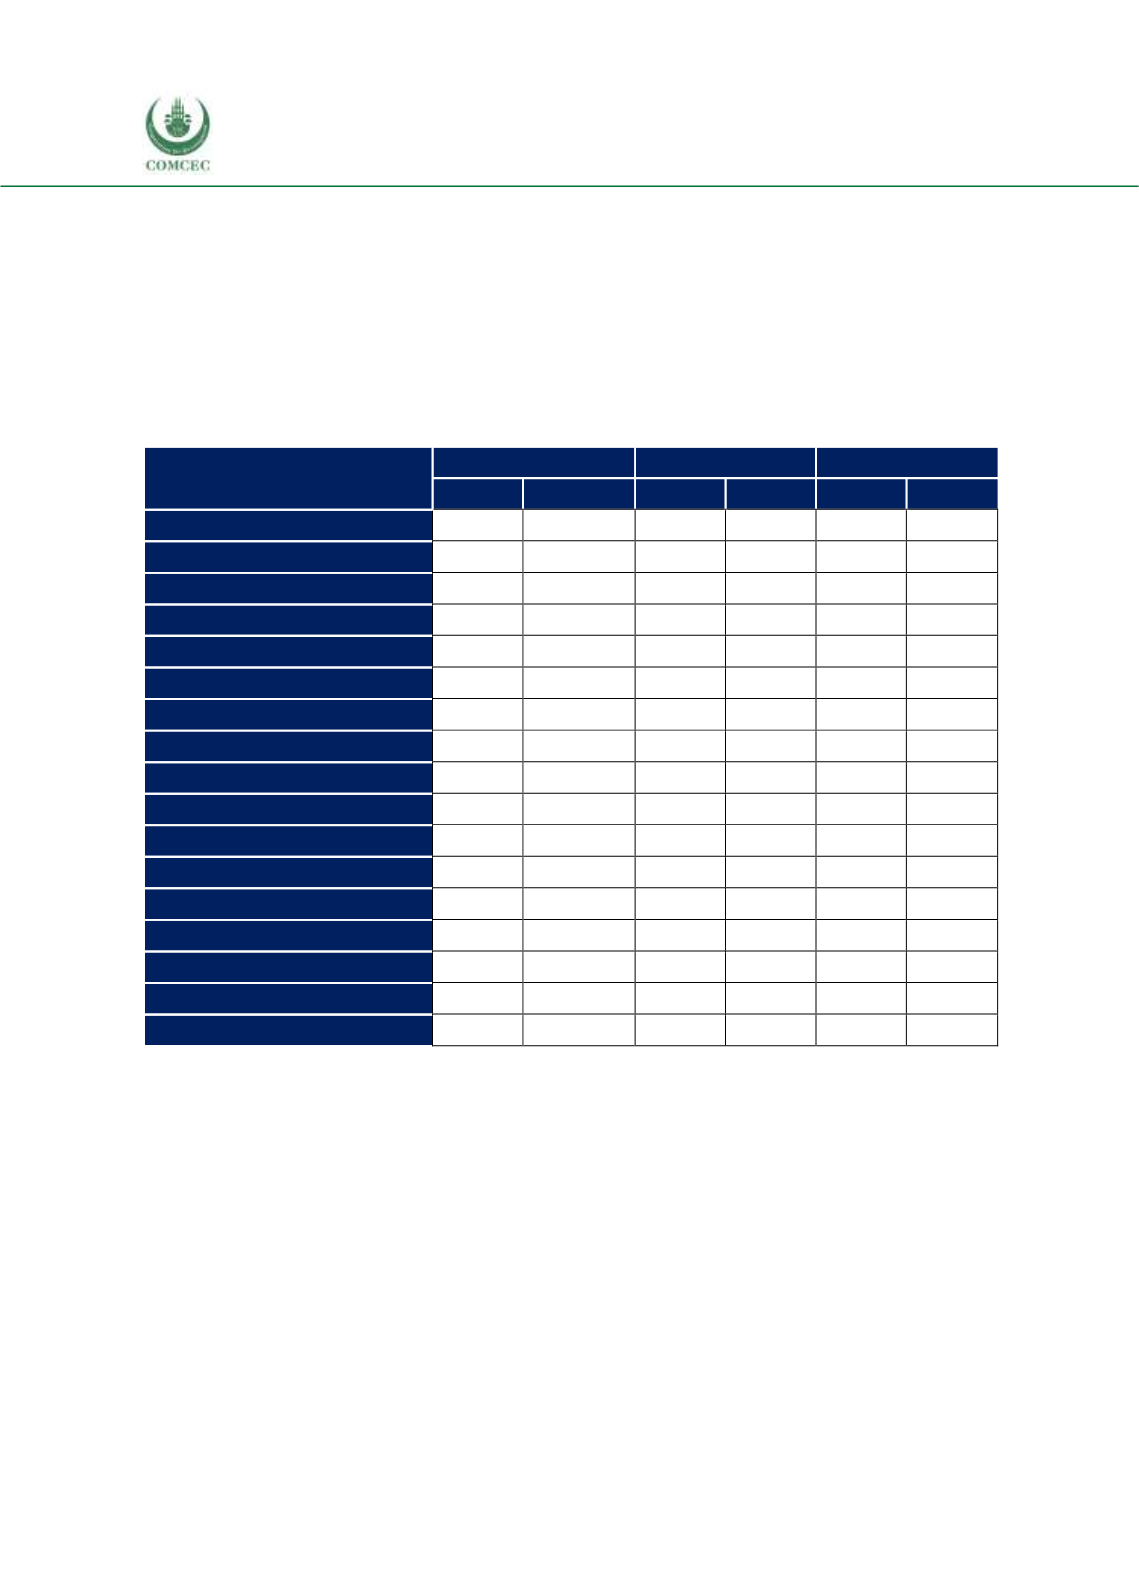
Table 3. 3 Percentage of Intra-OIC Exports Taking Place within RTAs, 2005 and 2016, %
Product
African Group
Arab Group
Asian Group
2005
2016
2005
2016
2005
2016
Live animals
99.6
99.95
99.94
98.94
8.02
78.2
Tobacco
83.39
71.56
91.69
50.32
50.9
49.41
Oil seeds
99.93
89.62
72.5
85.98
32.84
47.01
Crude rubber
87.93
98.95
93.75
95.44
51.37
25.62
Cork and wood
97.98
78.34
97.4
96.77
46.3
47.2
Rice
72.94
49.7
96.04
94.16
54.76
42.21
Vegetables
43.05
23.65
93.4
95.85
89.37
69.94
Fruit and nuts
9.38
76.61
97.66
97.84
69.77
63.6
Coffee
91.83
78.85
75.57
83.65
51.76
56.11
Other edible products
98.44
77.69
81.86
74.66
75.7
62.75
Cotton
50.24
59.65
57.93
99.53
90.81
88.97
Bread products
16.7
85.08
88.14
83.22
61.7
55.24
Palm oil
36.5
33.32
94.75
92.11
30.65
28.65
Fish and crustaceans
66.04
45.06
39.78
94.67
88.86
65.92
Cocoa and chocolate
99.19
21.05
87.04
77.91
73.06
72.79
Rest of 06
98.12
91.08
52.83
74.44
96.68
77.58
Rest of 04
99.98
86.1
45.31
99.14
60.46
68.07
Source: COMCEC (2018b).
Note: The product division 04 is for “Cereals and cereal preparations” and the rest of 06 includes those
other than wheat, rice, maize, barley, cereal flour, macaroni, and bread. The product division 06 is for
“Sugars, sugar preparations and honey” and the rest of 06 includes those other than beet and cane sugar,
natural honey, and sugar confectionery.
Finally, the Arab group’s average tariff applied to its top 5 imports is 0.8% for imports from the
same group, 8.6% for imports from the African group, and 16.3% from the Asian group. Again,
the 11.2% of average tariff applied to imports coming from the non-OIC countries is
considerably lower than the 16.3% applied to the Asian group, thereby implying a trade
diversion risk.