


 33 / 272

Reviewing Agricultural Trade Policies
To Promote Intra-OIC Agricultural Trade
21
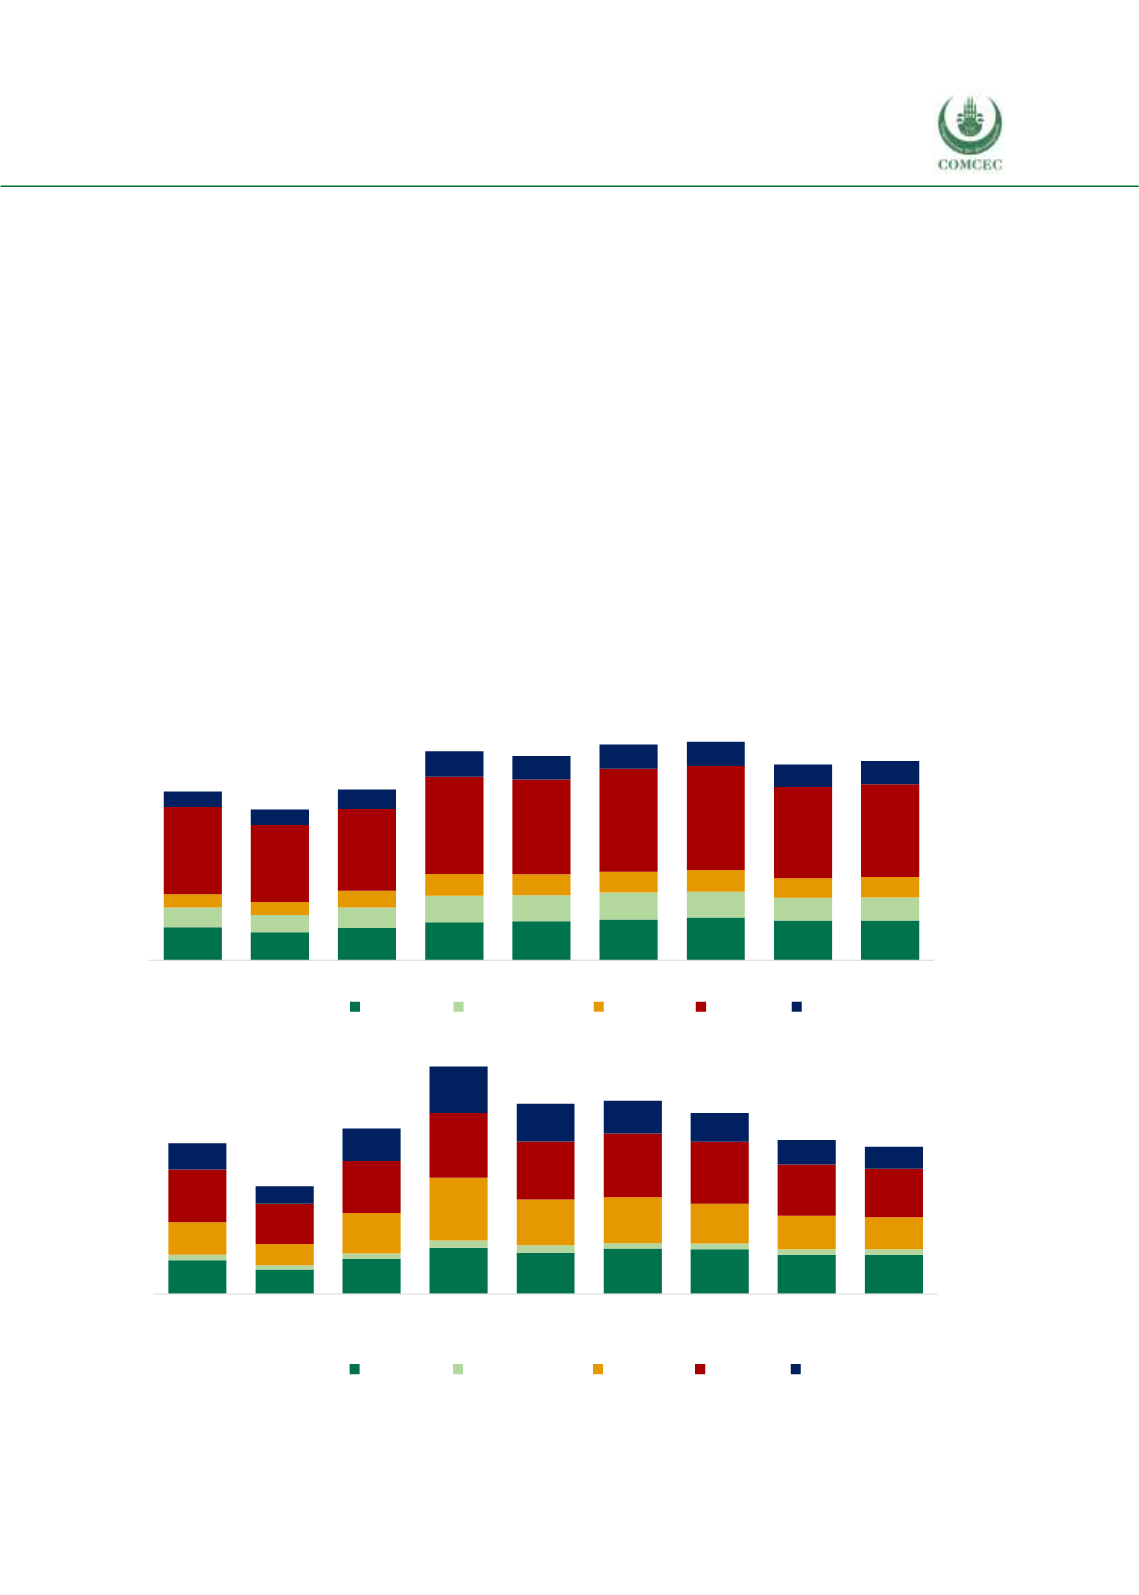
Since agricultural food products are more value-added than the agricultural raw materials, all
agricultural countries aim to increase their exports of the former category while decreasing the
latter. This trend can be observed on the agricultural rawmaterials exports for all the compared
groups except NAFTA and the Rest of the World (second graph of Figure 2. 4). However, for this
last group of countries there is a very rapid decrease since 2011, showing a clear decisiveness
of policy change in those countries towards more value-added agricultural exports. The group
whose reduction has been the most rapid in this category is OIC with 2.2% annual decrease in
the exports of the agricultural raw materials during the period. However, the highest export
volume of agricultural raw material was still realized by the Rest of the World in 2016, despite
the negative trend mentioned above.
Trading blocs have a tendency to leave the raw material exports to the Rest of the World while
continuing increasingly to export processed and higher value added agricultural food products.
A similar tendency is visible for Fish products. The leading group is the Rest of the World and
has increased its exports to reach 118 billion USD in 2011, while the latest figure available in
2016 is almost halved, down to 63 billion USD compared to a steady increase by the EU-28. Table
2.1 shows that average annual growth rate of exports from the Rest of the World in low value-
added agricultural rawmaterials has been 15.04%, while it diminished for the rest of the trading
blocs other than NAFTA.
Figure 2. 4 Agricultural Exports by Major Trading Blocs, Billion USD, 2008-2016
165
141
161
190
196
204
215
199
200
100
87
104
133
131
137
129
116
115
66
66
84
110
106
103
110
98
102
440
387
411
490
476
519
524
459
469
77
79
98
126
120
122
121
113
116
2008
2009
2010
2011
2012
2013
2014
2015
2016
Agri-food Products
NAFTA MERCOSUR ASEAN EU-28 OIC
22
16
23
31
27
30
30
26
26
4
3
4
5
5
4
4
4
4
22
14
27
42
31
31
27
22
21
35
27
35
43
39
42
41
34
32
18
12
22
31
25
22
19
16
15
2008
2009
2010
2011
2012
2013
2014
2015
2016
Agricultural Raw Materials
NAFTA MERCOSUR ASEAN EU-28 OIC