


 32 / 272

Reviewing Agricultural Trade Policies
To Promote Intra-OIC Agricultural Trade
20
Looking at the global distribution of agricultural import shares, EU-28 is the leading bloc despite
a considerable drop of its import share from 44% in 2008 to 36% in 2016. The change during
the period has been significant also for ASEAN’s; its share doubling and reaching 8% in 2016
while the OIC’s share increased only by 2 percentage points and reached 14% with NAFTA’s
share remaining almost constant (13% and 14% respectively). The Rest of the World’s share
changed from 38% to 41% in the same period. In terms of the annual average growth rate of the
imports, ASEAN led with 9.8%, followed by OIC with 4.3% and NAFTA with 3.6%, slightly higher
than the Rest of the World’s average annual agricultural import increase of 3.6% in the period
considered. MERCOSUR member countries realized an average annual decrease of 2.7% during
this period, having reduced apparently the agricultural import need of the bloc. The EU-28
imports can be considered to be stabilized as the annual change has been of only -0.1%.
The analysis should also include the agricultural trade balance of the trading blocs. Two groups
clearly come out: NAFTA, MERCOSUR and ASEAN form the group with an agricultural trade
surplus while EU-28, OIC and the Rest of the World the group with a trade deficit. NAFTA’s
surplus fluctuated within a band of 30 to 60 billion USD, together with the ASEAN’s surplus in a
band of 30 to 80 billion USD. MERCOSUR is the only trading bloc which agricultural trade surplus
indicated a clear increasing trend, from 83 in 2008 to 102 billion USD in 2016, with some higher
surplus years in between. Despite being among those with an agricultural trade deficit, EU-28
managed to reduce clearly its deficit and reached almost balanced agricultural trade in 2016. In
the period considered, the only group whose agricultural trade deficit continued to increase is
the Rest of the World including OIC, for which the trade deficit in the agriculture, increased from
41 billion USD in 2008 to 83 in 2014, to finally reducing to 60 billion USD in 2016.
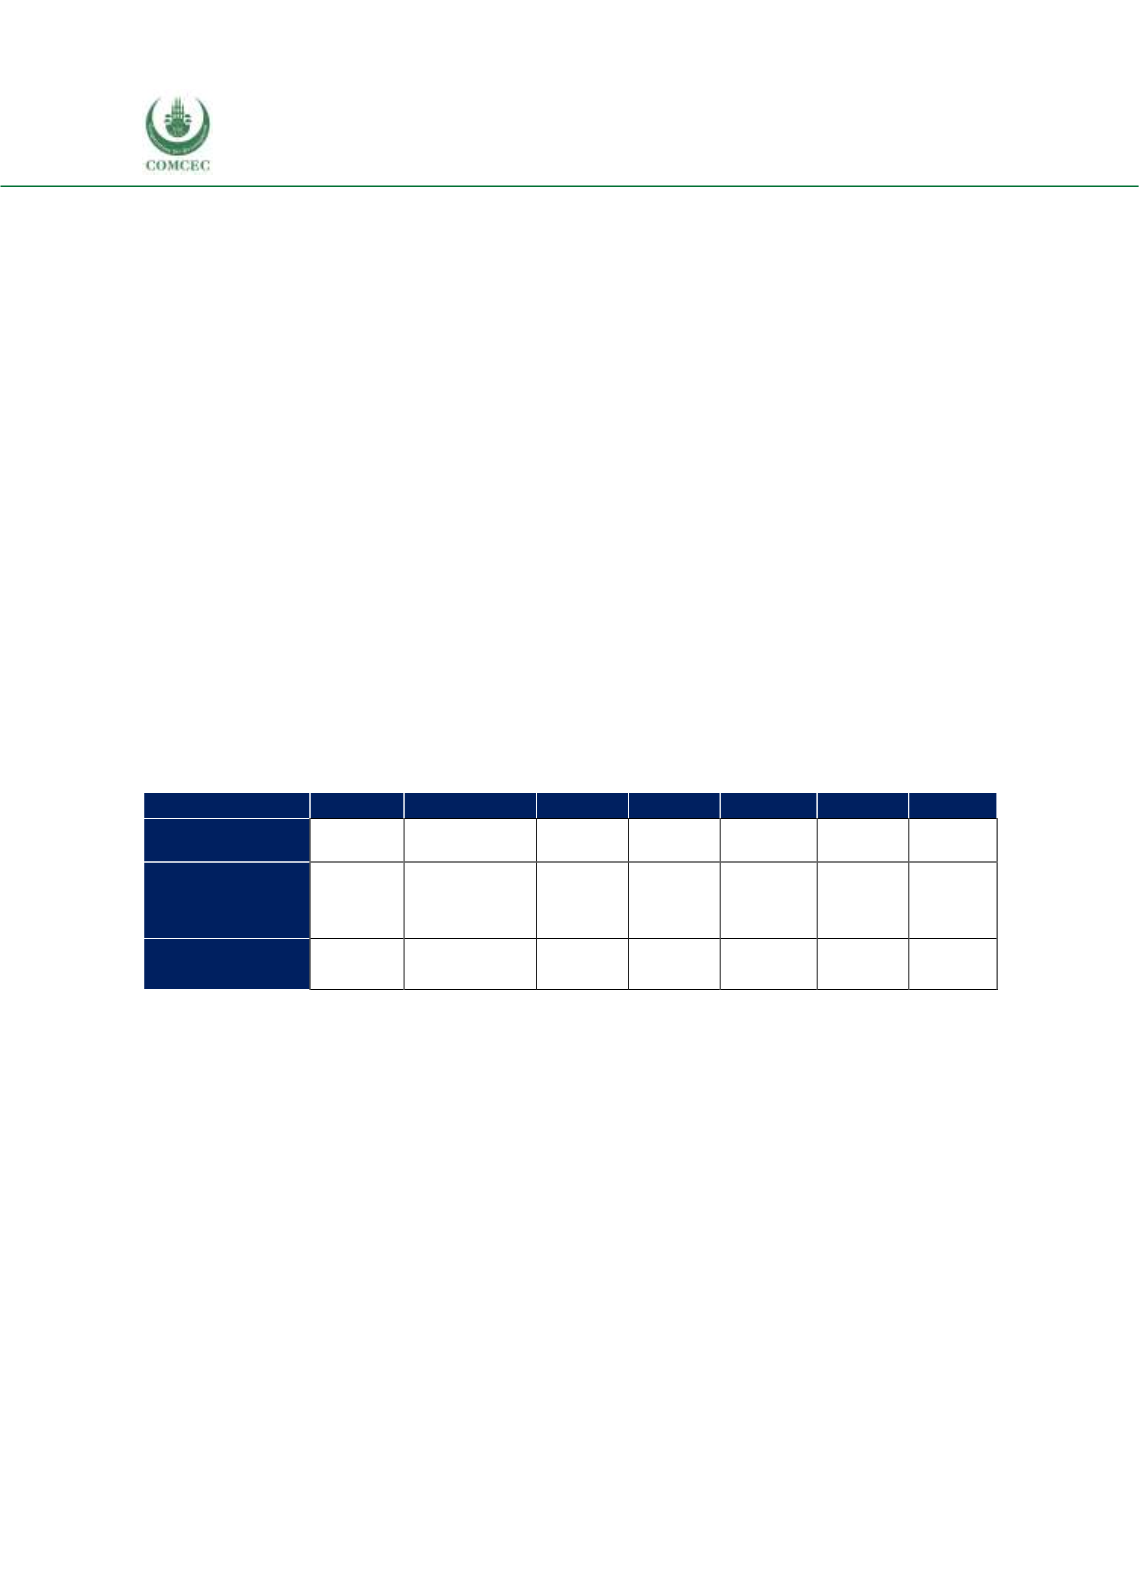
Table 2. 1 Average Annual Growth Rate of Agricultural Exports, 2008-2016
NAFTA
MERCOSUR
ASEAN
EU-28
Others
OIC
World
Agri-food
Products
2.39%
1.80%
5.63%
0.81%
4.57%
5.31%
2.46%
Agr. Raw
Materials
1.91%
-0.76%
-0.10%
-1.02%
15.04%
-2.22%
3.66%
Fish Products
3.05%
1.42%
1.26%
2.34%
-1.31%
3.95%
0.24%
Source: ITC Macmap, CEPII BACI, Eurostat RAMON, UN Comtrade, UN Trade Statistics, and authors’
calculations
It should be added that the period comprised the biggest global economic crisis ever. The
fluctuations clearly seen in global agricultural trade is the impact of the crisis on the sector.
Another decreasing trend is noticeable starting from 2015.
The overview of the global agricultural trade requires a further look at the product category
level, the categories being agricultural food, fish and agricultural raw materials. Figure 2. 4
shows the change in the global agricultural exports, by major trading blocs and by category and
for the period 2008-2016. In the agricultural food products exports, EU-28 is leading followed
by NAFTA, OIC and MERCOSUR and finally by ASEAN in 2016. It should be noted that the highest
average annual growth rate of agricultural food products exports has been achieved by ASEAN
(5.6%) followed by the OIC (5.3%) and the Rest of the World (4.6%), the three rates being much
higher than the global growth of 2.5% during the period. This is due to the low growth of the
largest exporter EU-28 (0.8%), followed by MERCOSUR (1.8%) and NAFTA (2.4%) in increasing
order and all three lower than the world average.