


 30 / 272

Reviewing Agricultural Trade Policies
To Promote Intra-OIC Agricultural Trade
18
2.1. Overview of Global Agricultural Trade
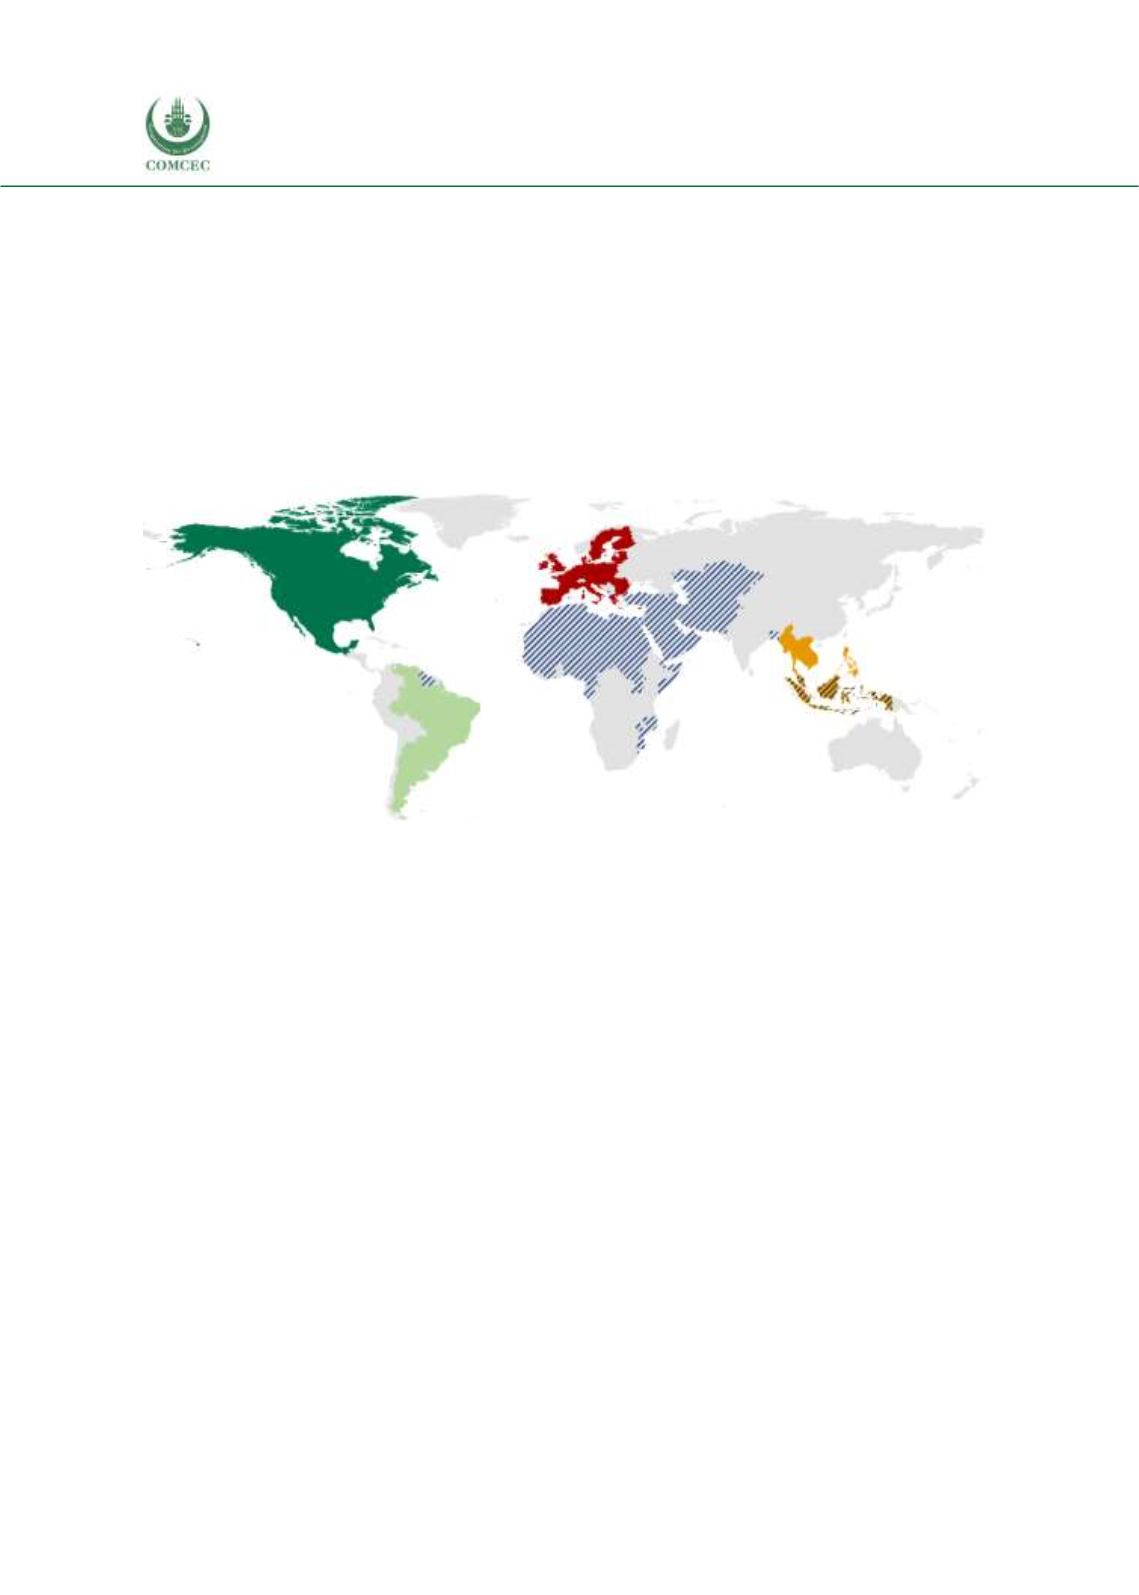
In 2016, 70% of agricultural products’ exports originated from one of the four major trading
blocs, namely ASEAN, EU-28, MERCOSUR, and NAFTA. The geographic distribution of those
trading blocs, together with OIC member countries is seen in Figure 2. 1. The respective shares
of those four trading blocs in the world exports of agricultural products are 10%, 36%, 8% and
16%. OIC members’ agricultural exports share is 10%, constituting one third of the Rest of the
World. Note that three of OIC member countries, namely Brunei Darussalam, Indonesia and
Malaysia are also ASEAN members and the related double counting is inevitable but of minor
importance.
Figure 2. 1 Map of Major Trading Blocs and OIC Members
Source: Authors’ own visualizations.
Note: OIC member countries are shaded with blue lines. Percentages denote the shares of the blocs in
world exports of agricultural products. Three of OIC member countries, namely Brunei Darussalam,
Indonesia and Malaysia are also ASEAN members and the related double counting is inevitable but of
minor importance.
Figure 2. 2 gives an idea about the evolution of global exports by major trading blocs. In the
period considered (2008-2016) while world total agricultural exports grew by 2.4% annually,
the highest growth rate of 4.3% has been achieved by OIC member countries, followed closely
by the ASEAN bloc with 4%. It is interesting to note that the lowest increase was realized by the
EU-28. MERCOSUR followed with only 1.7%, despite all members being major agricultural
producers. In the same period, NAFTA’s agricultural exports grew 2.4% annually, slightly higher
than the global exports. This is how the share of NAFTA (16%) in global agricultural exports did
not change while the EU’s share decreased from 40% in 2008 to 36% in 2016 with 530 billion
USD. In 2016 NAFTA exported 238 billion USD of agricultural products. OIC’s exports increased
from 104 billion USD in 2008 to 144 billion USD in 2016, with its share changing from 8% to
10%. The high annual growth rate of OIC member countries agricultural exports, compared to
the Rest of the World shows the group’s potential in world agricultural trade.
EU-28
%36
NAFTA
%6
MERCOSUR
%8
ASEAN
%10
OIC %10