
Reviewing Agricultural Trade Policies
To Promote Intra-OIC Agricultural Trade
19
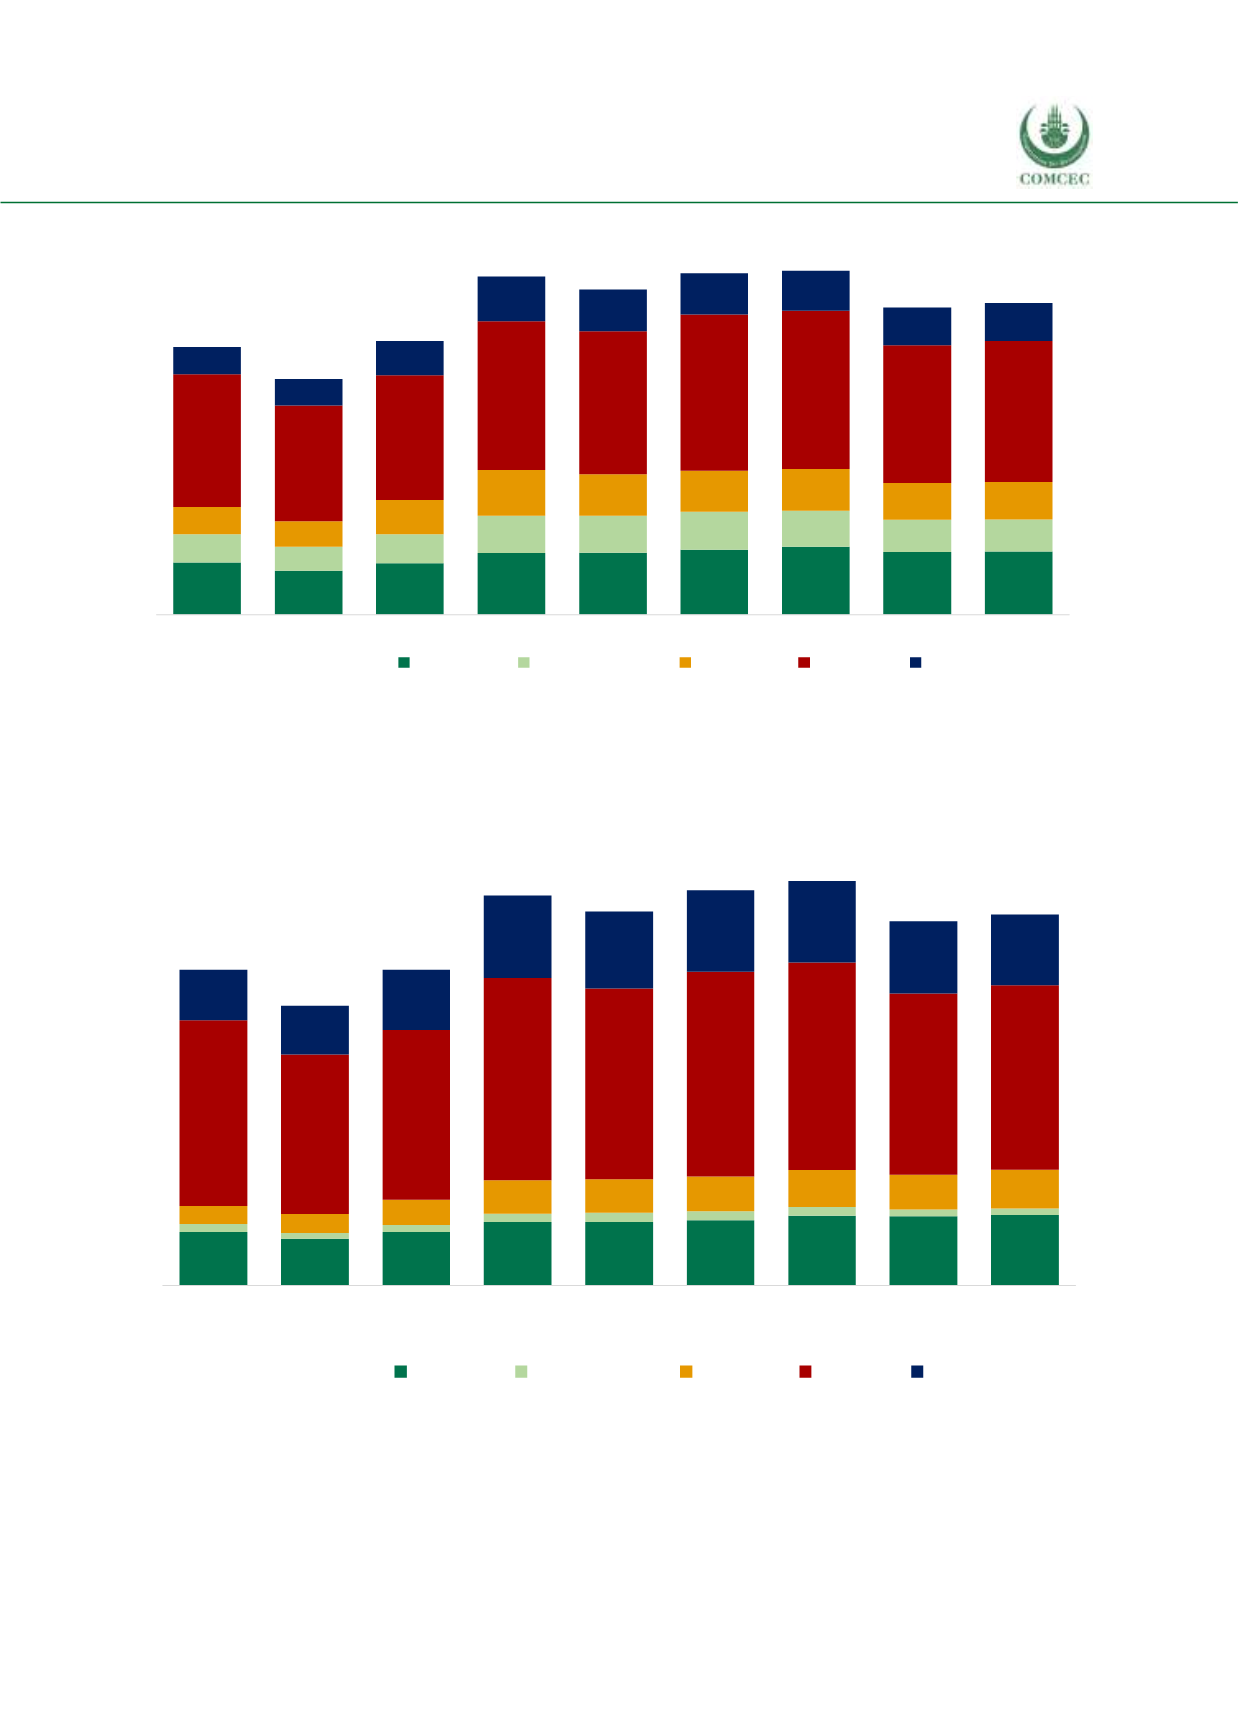
Figure 2. 2 Agricultural Exports by Major Trading Blocs, Billion USD, 2008-2016
Source: CEPII BACI, Eurostat RAMON, UN Comtrade, UN Trade Statistics, and authors’ calculations.
Note: Three of OIC member countries, namely Brunei Darussalam, Indonesia and Malaysia are also ASEAN
members and the related double counting is inevitable but of minor importance.
Figure 2. 3 Agricultural Imports by Major Trading Blocs, Billion USD, 2008-2016
Source: ITC Macmap, CEPII BACI, Eurostat RAMON, UN Comtrade, UN Trade Statistics, and authors’
calculations.
Note: Three of OIC member countries, namely Brunei Darussalam, Indonesia and Malaysia are also ASEAN
members and the related double counting is inevitable but of minor importance.
197
165
194
232
234
245
257
237
238
106
91
109
140
138
143
135
121
121
104
96
129
173
157
154
158
139
142
498
436
469
560
539
589
594
519
530
104
99
129
168
156
156
152
141
144
2008
2009
2010
2011
2012
2013
2014
2015
2016
NAFTA MERCOSUR ASEAN EU-28 OIC
154
134
154
182
183
187
200
200
204
23
17
20
25
26
27
26
19
18
53
54
73
95
97
100
106
100
111
535
459
489
582
549
589
597
521
531
145
141
173
238
222
235
235
209
204
2008
2009
2010
2011
2012
2013
2014
2015
2016
NAFTA MERCOSUR ASEAN EU-28 OIC


