


 169 / 227

Improving Public Debt Management
In the OIC Member Countries
155
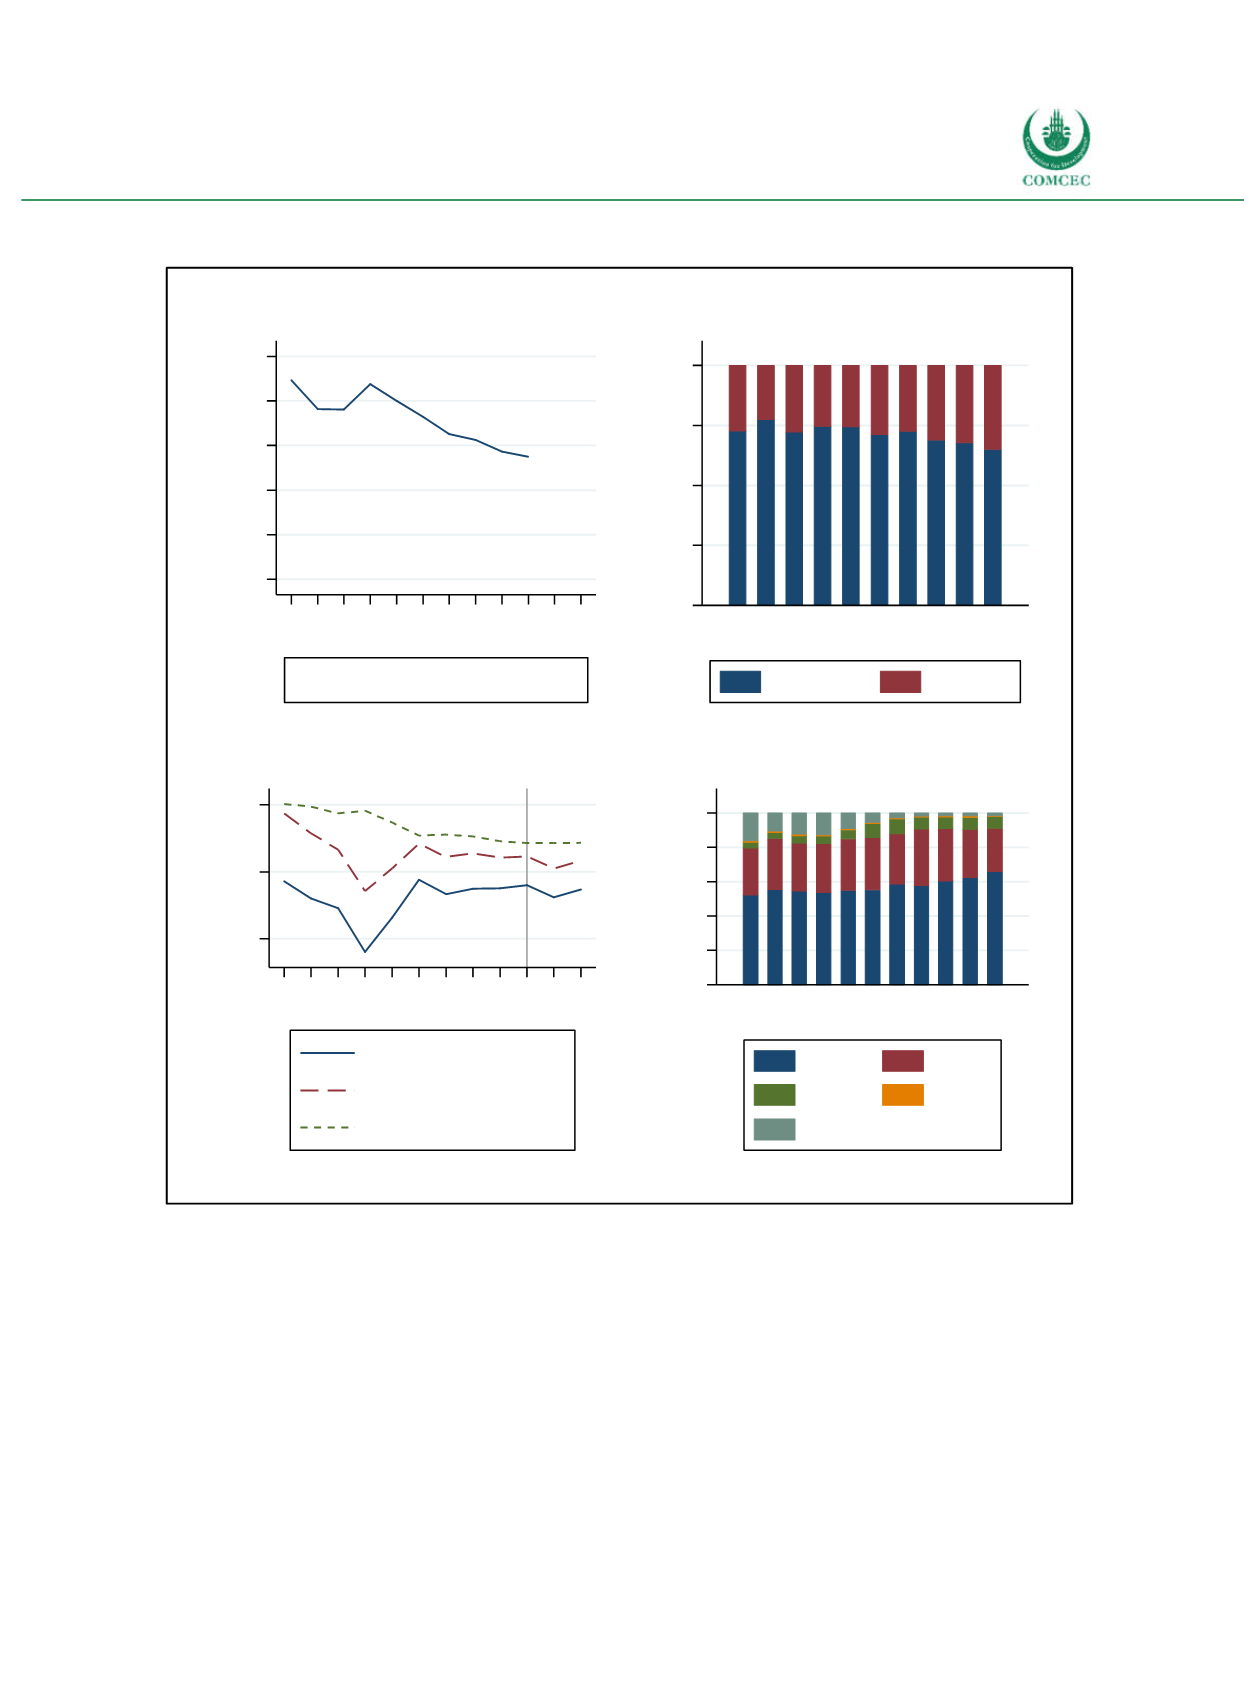
Figure 4-35: Turkey – General Government Debt Dynamics
Sources: Turkish Treasury (2017), WEO (2016), IMF (2016), calculations by the Ifo Institute.
0 10 20 30 40 50
% of GDP
2006
2007
2008
2009
2010
2011
2012
2013
2014
2015
2016
2017
Gross general government debt
Gross Public Debt
0
25
50
75
100
% of total public debt
2006
2007
2008
2009
2010
2011
2012
2013
2014
2015
Creditor Structure of Public Debt
Domestic
External
-5
0
5
% of GDP
2006
2007
2008
2009
2010
2011
2012
2013
2014
2015
2016
2017
Net lending
Primary net lending
Net interest payments
Net Lending
0 20 40 60 80 100
% of ext. public debt
2006
2007
2008
2009
2010
2011
2012
2013
2014
2015
2016
Currency Structure of Ext. Public Debt
USD
EUR
JPY
Other
SDR