
National and Global Islamic Financial Architecture:
Prolems and Possible Solutions for the OIC Member Countries
37
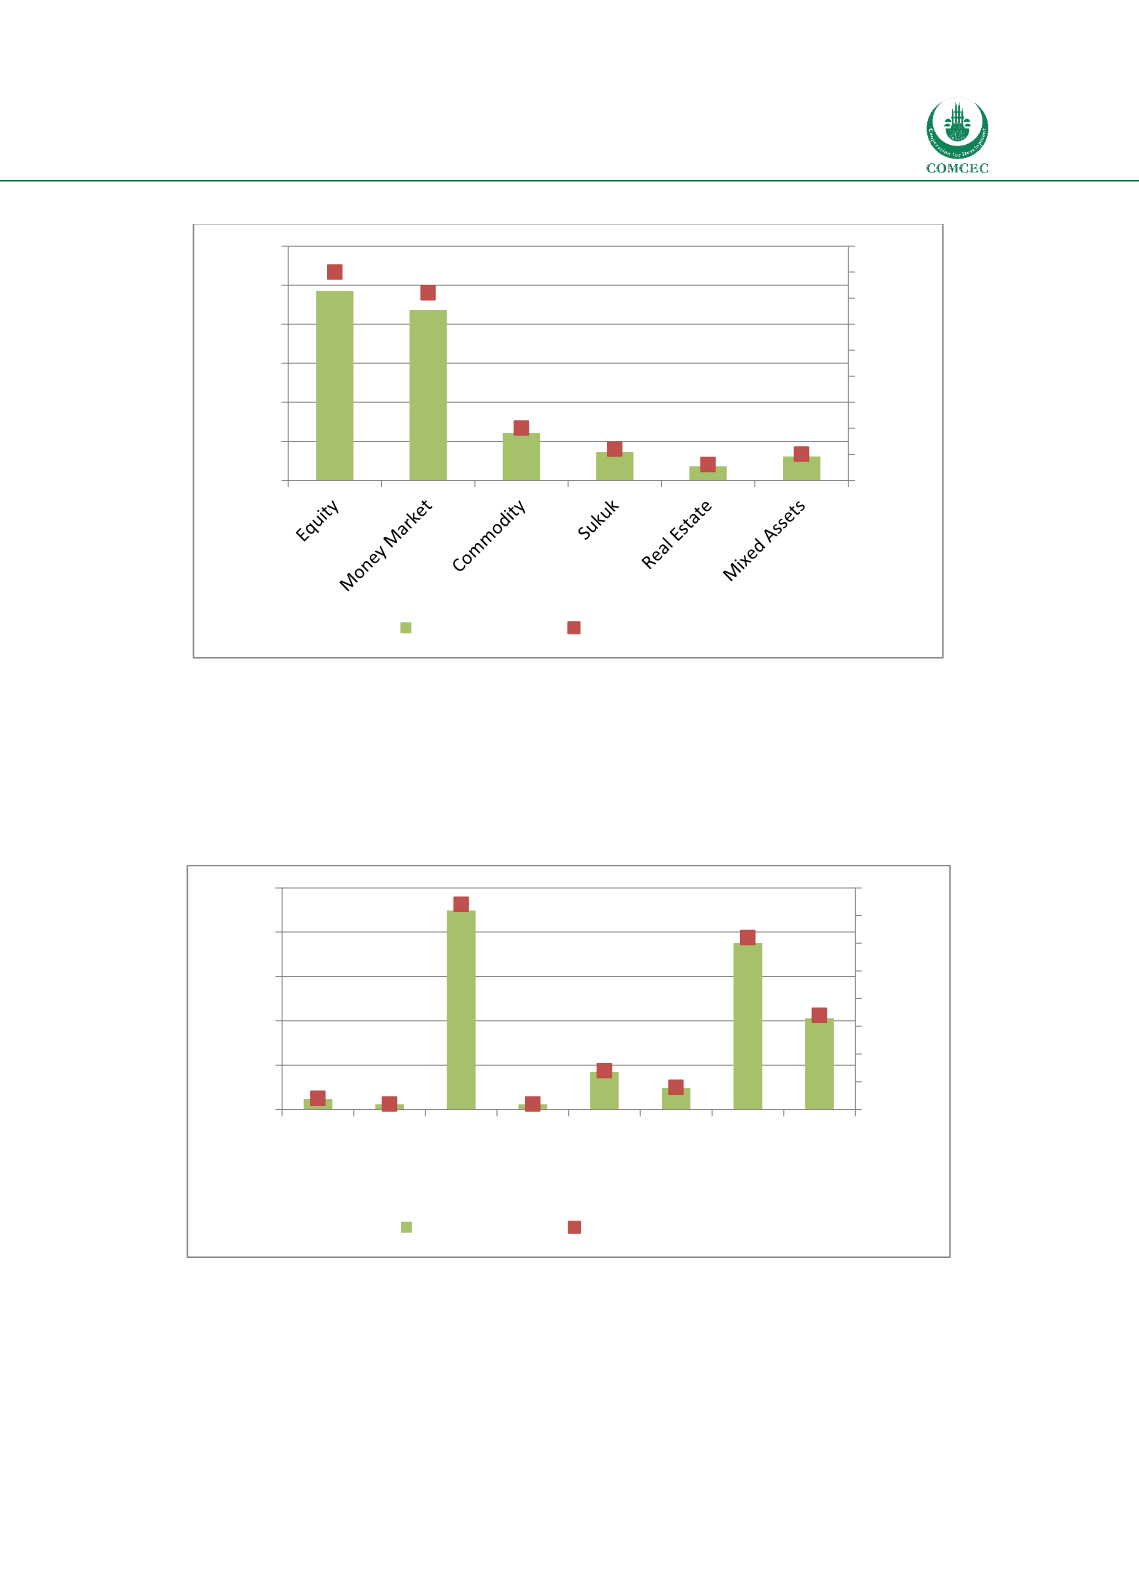
Chart
2.21: Global Islamic Funds: Asset Class (2014)
Source: Calculated from Thomson Reuters Global Islamic Asset Management Outlook 2015
Chart 2.22 shows the geographical distribution of Islamic funds. The GCC region is the host to
most (37%) of the funds worth USD 22.44 billion followed by South East Asia with funds of
USD 18.8 billion. The assets under management of the rest of the world (ROW) amount to USD
10.31 billion (17%) with North America being at USD 4.25 billion (7%) and the remaining
regions having less than 5% of the funds.
Chart
2.22: Global Islamic Funds: Geographical Distribution of Issuances (2014)
Source: Calculated from Thomson Reuters Global Islamic Asset Management Outlook 2015
During the year 2014, a total of 100 new funds worth USD 2.27 billion were launched. Charts
2.23 and 2.24 show the status of Islamic funds for the year 2014 with the former showing the
geographical origins of the new funds launched during the year and the latter showing their
asset classes. The bulk of the new sukuk issued in 2014 (USD 1157.7 million) originated from
South East Asia. While GCC launched funds were worth USD 317.80 million (14% of the total)
24,26
21,83
6,07
3,64
1,82
3,03
40
36
10
6
3
5
0
5
10
15
20
25
30
35
40
45
0
5
10
15
20
25
30
Percentage
UDUSD (bn.)
AuM (US$, bn.)
Percentage of Total
1,21
0,61
22,44
0,61
4,25 2,43
18,80
10,31
2
1
37
1
7
4
31
17
0
5
10
15
20
25
30
35
40
0
5
10
15
20
25
Africa Europe GCC Non
GCC
MENA
North
America
Other
Asia
South
East
Asia
ROW
Percentage
USD (bn.)
AuM (US$, bn.)
Percentage of Total


