


 128 / 228

Infrastructure Financing through Islamic
Finance in the Islamic Countries
112
vis-à-vis the entire industry in terms of deposit mobilization, credit/financing and asset base
over a 3-year period are presented in Table 4.3.1 below:
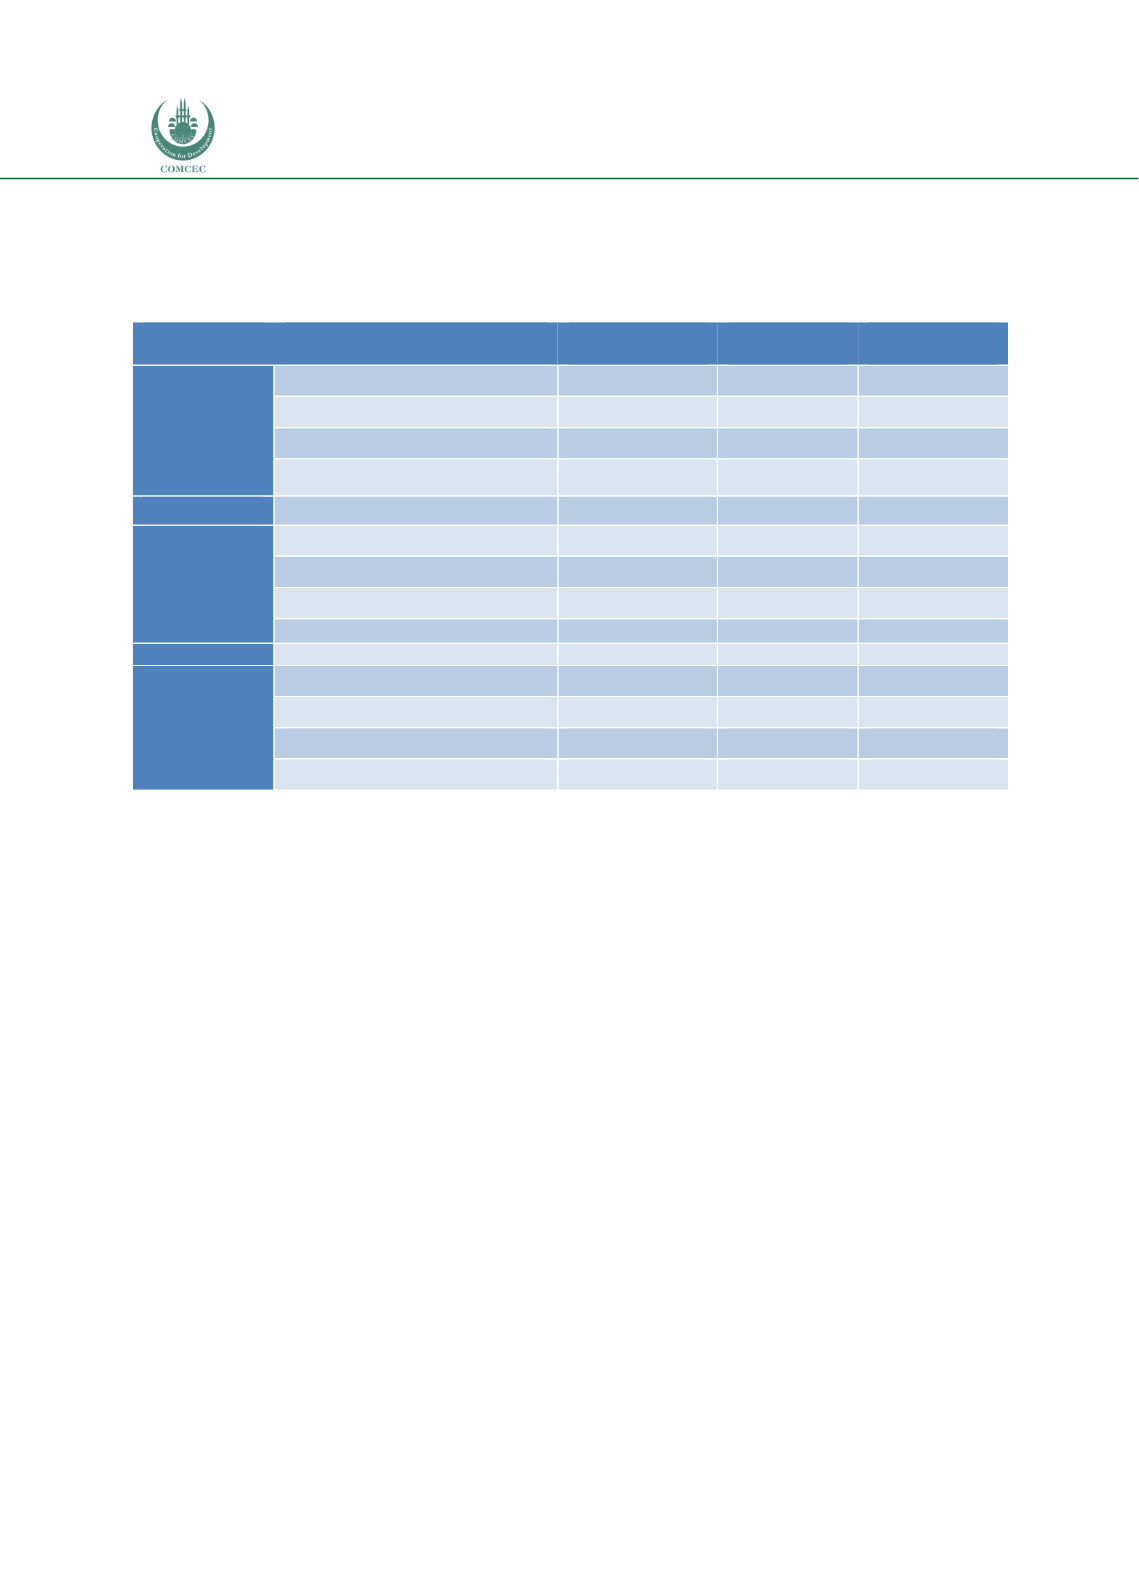
Table 4.3. 1: Performance indicators of Conventional and Islamic banks
(USD million; Exchange rate: USD1 = N305.8)
Total Deposits
DEC. 2015 (USD
Million)
DEC. 2016
(USD Million)
DEC. 2017 (USD
Million)
Conventional banks
57,104.18
60,626.10
63,364.78
Non-Interest banks
129.90
164.43
222.74
INDUSTRY
57,234.08
60,790.54
63,587.53
% Non-interest banks/Industry
0.23
0.27
0.35
Total Credits
Conventional banks
43,586.57
53,165.88
52,035.78
Non-Interest banks
83.06
115.62
122.67
INDUSTRY
43,669.62
53,281.50
52,158.45
% Non-interest banks/Industry
0.19
0.22
0.24
Total Assets
Conventional banks
88,169.55
98,597.43
106,416.45
Non-Interest banks
177.59
229.81
297.60
INDUSTRY
88,347.14
98,827.25
106,714.05
% Non-interest banks/Industry
0.20
0.23
0.28
Source: Central Bank Nigeria (CBN) Financial Analysis (FinA) System
Table 4.3.1 shows that Islamic banks contributed only 0.23%, 0.27% and 0.35% of the entire
deposits in the industry in 2015, 2016 and 2017 respectively. Similarly, Islamic banks
contributed only 0.19%, 0.22% and 0.24% of the total credit/financing in the industry over the
same period respectively while the contribution by Islamic banks was only 0.20%, 0.23% and
0.28% of the total assets in the industry in 2015, 2016 and 2017 respectively. Overall, even
though the performance of Islamic banks relative to the entire industry was dismal on all the
three indicators, it portrayed a steady, marginal growth over the period.
The Islamic capital market in Nigeria comprises of Islamic mutual funds and Sukuk. There are
two types of Islamic funds in the market: closed and open-ended mutual funds. The open-
ended mutual funds are the Lotus Capital Halal Fund and the Stanbic IBTC Imaan fund while
the closed fund is the Lotus Halal Exchange Traded Fund (ETF). The net asset value (NAV) of
the Islamic funds vis-à-vis the total funds in the industry for the period 2015-2017 is
presented Table 4.3.2. Even though the NAV of the Islamic fund consistently rose over the
period, its composition in the industry fluctuated as it was 1% in 2015 before increasing to
1.26% in 2016 and then declining to 0.76% in 2017. This fluctuation is explained by the
fluctuating conventional mutual funds over the period.