


 84 / 247

65
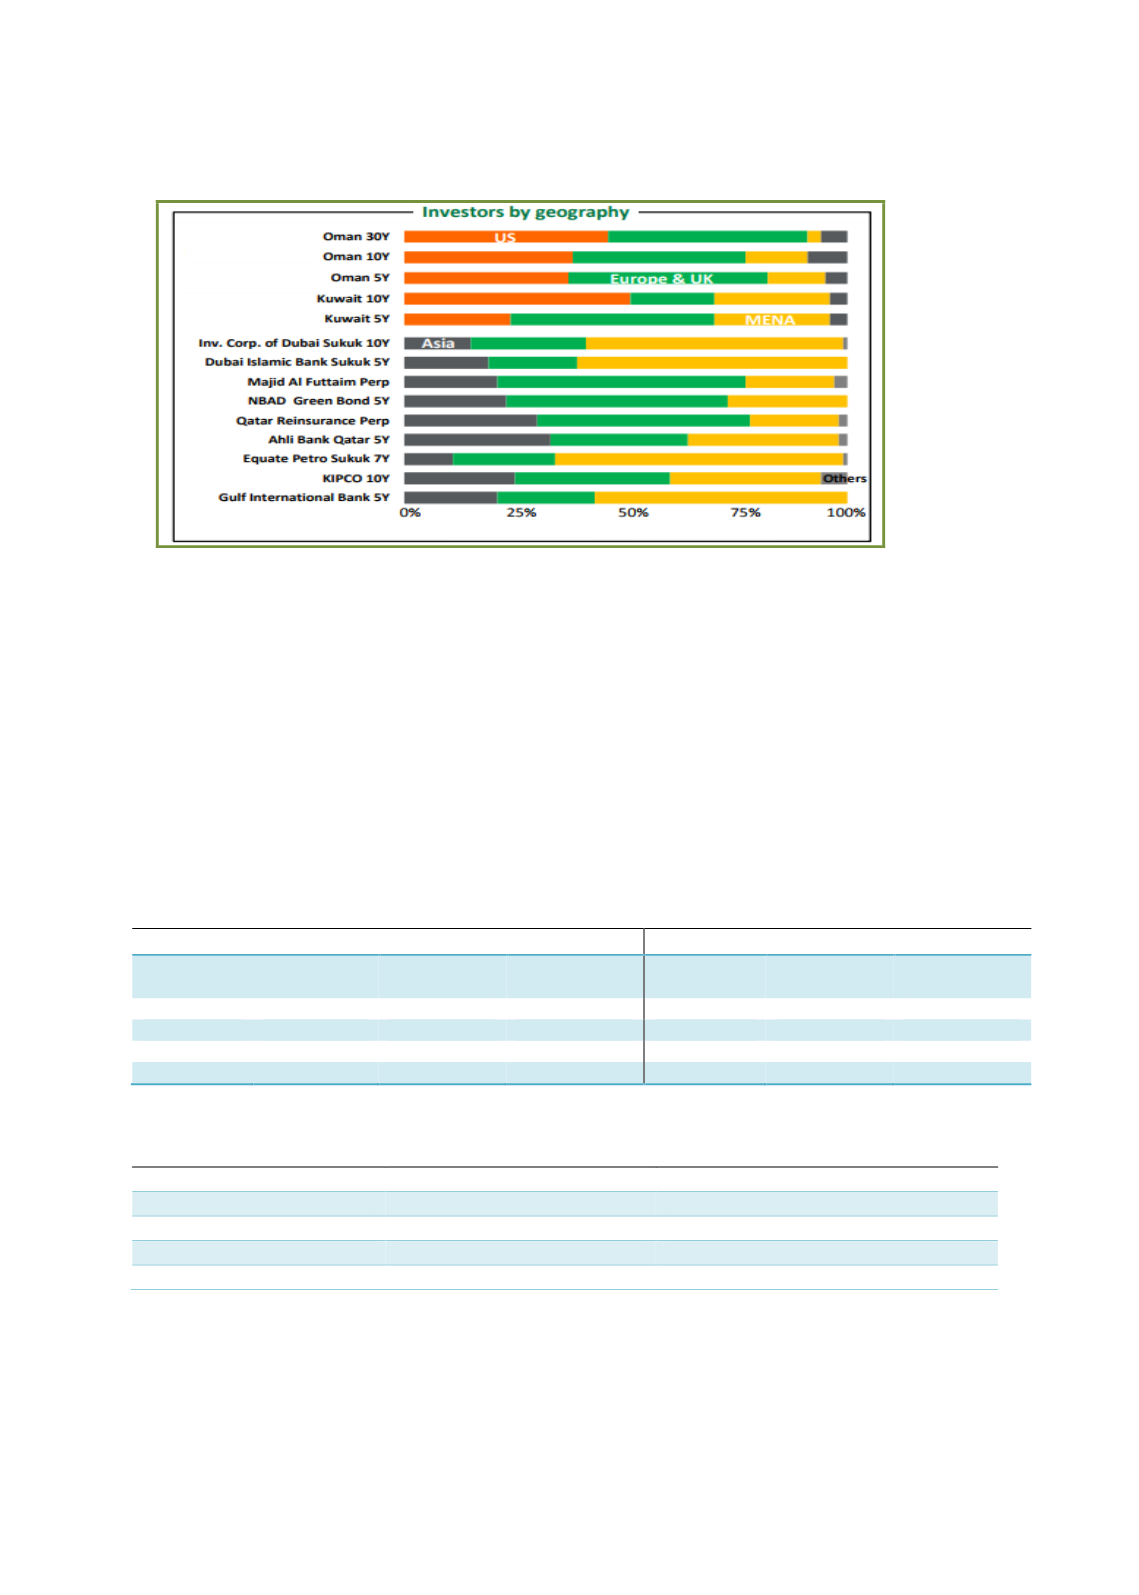
Source: Bloomberg (2017, April)
3.5.2
ASIAN REGION
Hong Kong and Malaysia have undergone healthy developments in terms of the composition of
their financial markets. Indonesia is still attempting to establish a higher ratio of its
outstanding bond market against its GDP. The Indonesian government and regulators
acknowledge the need to effectively diversify the country’s funding sources and have
embarked on several measures to do so. Nonetheless, such efforts require persistence to
ensure successful implementation. Table 3.16 shows the compositions of financial markets as a
percentage of their GDP while Table 3.17 highlights the key indicators of financial
intermediation by NBFIs as a percentage of GDP for some Asian countries. Meanwhile, Box 3.6
elucidates the depth of NBFIs in the Malaysian market.
Table 3.16: Composition of Selected Asian Financial Markets as a Percentage of GDP
Historical data
Data based on latest available date
Country
Outstanding
bond
Outstanding
loan
Market
Capitalization
Outstanding
bond
Outstanding
loan
Market
Capitalization
Hong Kong
6.0% (1997) 163.5%(1990)
80.6% (1975) 66.5%(2016) 271.5%(2014) 995.1% (2016)
Indonesia
17.0%(2008) 12.6% (1980)
32.9% (1995) 25.0%(2016) 36.2% (2014)
45.7% (2016)
Malaysia
51%(1997) 75.9% (1980)
61.2% (1981) 102.0%(2016) 135.0%(2014) 121.4% (2016)
Pakistan
4.2% (2012) 32.3% (1980)
24.6% (1993) 18.2% (2016) 36.0% (2014)
15.3% (2011)
Sources: The Global Economy, BNM, SC, Asia Bond Online
Table 3.17: Key Indicators of Financial Intermediation by NBFIs as a Percentage of GDP
Country
NBFIs assets as % to GDP
Pension fund assets as % to GDP
Hong Kong
n/a
37.4% (2014)
Indonesia
3.3% (2014)
1.69% (2011)
Malaysia
n/a
57.9% (2014)
Pakistan
n/a
0.02% (2012)
Source: The Global Economy