


 87 / 247

The Role of Sukuk in Islamic Capital Markets
68
3.5.3
AFRICAN REGION
In terms of financial market development, African countries liberalized their financial sectors
in the late 1980s and 1990s, as part of the structural adjustment programmes promoted by the
IMF and the World Bank. The reforms included the removal of credit ceilings, the liberalization
of interest rates, the restructuring and privatization of state-owned banks, and the
introduction of a variety of measures to promote the development of private banking systems
and financial markets (Review of Development Finance, 2015). These measures had been
accompanied by bank supervisory and regulatory schemes, including the introduction of
deposit insurance in certain countries (Cull et al, 2005). South Africa’s financial market seems
to be the most advanced compared to its peers, as depicted by an increase in its outstanding
bonds and market capitalization as a percentage of GDP. Overall, despite the growth of Africa’s
financial system, it remains relatively underdeveloped compared to other up-and-coming
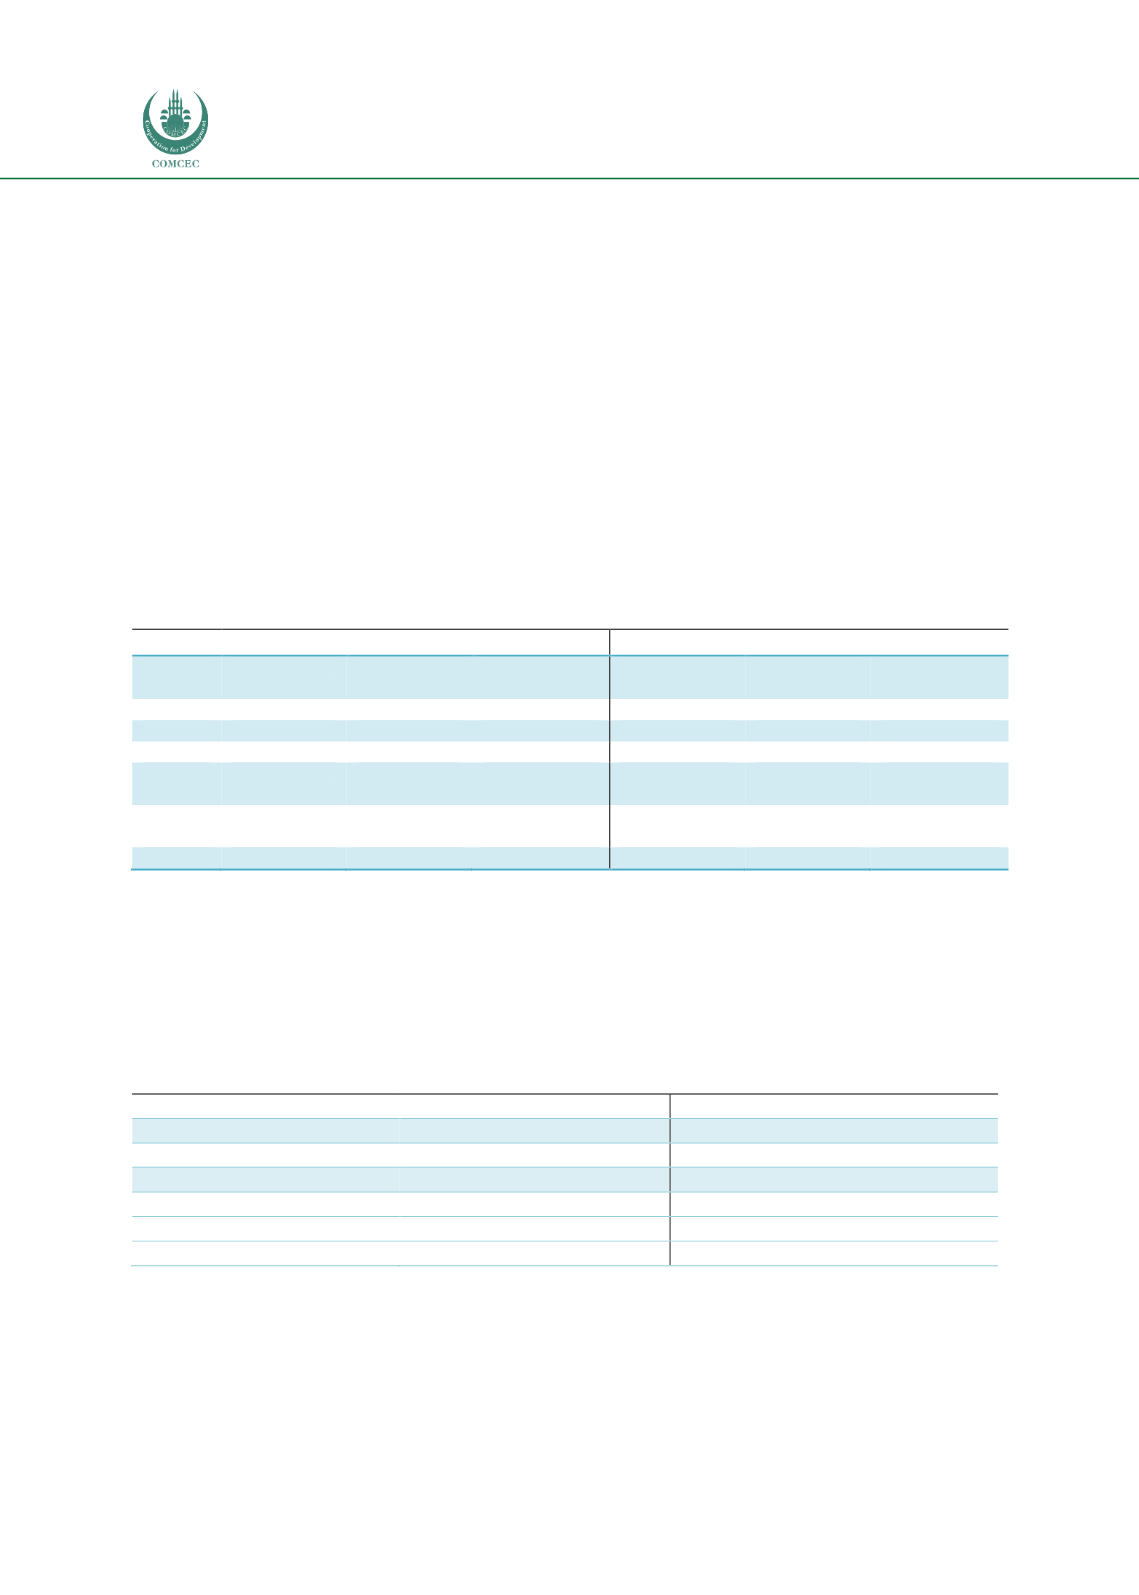
emerging markets. Table 3.18 shows the composition of financial markets as a percentage of
GDP.
Table 3.18: Composition of Selected African Financial Markets as a Percentage of GDP
Historical data
Data based on latest available date
Country Outstanding
bond
Outstanding
loan
Market
Capitalization
Outstanding
bond
Outstanding
loan
Market
Capitalization
Gambia
0% (2012) 42.4%(1980)
17.0% (2003)
0.2% (2016) 40.4%(2014)
n/a
Nigeria
5.5% (2012) 18.2%(1980)
14.0% (2003)
12.4% (2016) 18.3%(2014)
7.4% (2016)
Senegal
8.4% (2012) 38.4%(1980)
n/a
30.0% (2016) 38.8%(2014)
n/a
Ivory
Coast
50.9%(2012) 40.8%(1980)
12.0% (2003) 120.4%(2016) 26.3%(2014)
34.2% (2016)
South
Africa
34.0%(2012) 49.6%(1980)
161.6%(2003)
82.7%(2016) 77.2%(2014) 322.7%(2016)
Sudan
n/a 17.0%(1980)
n/a
n/a
9.8% (2014)
n/a
Source: The Global Economy
*n/a. – not available
Based on the composite mix of investors, Africa’s debt securities are mainly held by foreign
holders. Although African governments have implemented measures to heighten the
development of NBFIs, challenges such as financial inclusion and a low savings rate have been
hampering progress, as depicted in Table 13.9.
Table 3.19: Key Indicators of Financial Intermediation by NBFIs as a Percentage of GDP
Country
NBFIs assets as % to GDP
Pension fund assets as % to GDP
The Gambia
n/a
n/a
Nigeria
n/a
4.4% (2012)
Senegal
n/a
n/a
Ivory Coast
n/a
n/a
South Africa
120.3% (2014)
40.8% (2014)
Sudan
n/a
n/a
Source: The Global Economy
*n/a. – not available