


 82 / 247

63
Value Proposition
Key to the sustainability of a sukuk market’s development is the establishment of an LCY sukuk
market where the private sector participates frequently. To attract the private sector is to
build a strong value proposition for sukuk that is embedded in the country’s roadmap or
financial masterplan. The stability of macroeconomic factors plays a significant role in
determining the stage of the sukuk market’s progress. The amalgamation of all these factors is
a prerequisite for the growth of a country’s ICM.
3.5
COMPREHENSIVE ASSESSMENT OF SUKUK INVESTMENTS – DEMAND
(BUY SIDE)
3.5.1
ARAB REGION
According to the World Bank, the financial industry in the GCC is generally dominated by the
banking sector. NBFIs have a limited presence in the GCC. Investment funds have been
increasing rapidly in several countries, although largely focused on domestic equities and real
estate. The insurance sector remains small and targets property/casualty risks. Contractual
savings are underdeveloped and dominated by public pension systems, which are mainly
defined as “pay as you go” schemes (World Bank Group, 2015). They contribute little to the
accumulation of long-term resources for investment. Since most investment funds are owned
by banks, it is not surprising that domestic investors of GCC sukuk largely comprise local
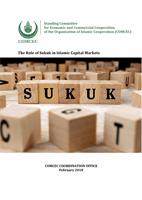
financial institutions. Table 3.14 shows the compositions of financial markets as a percentage
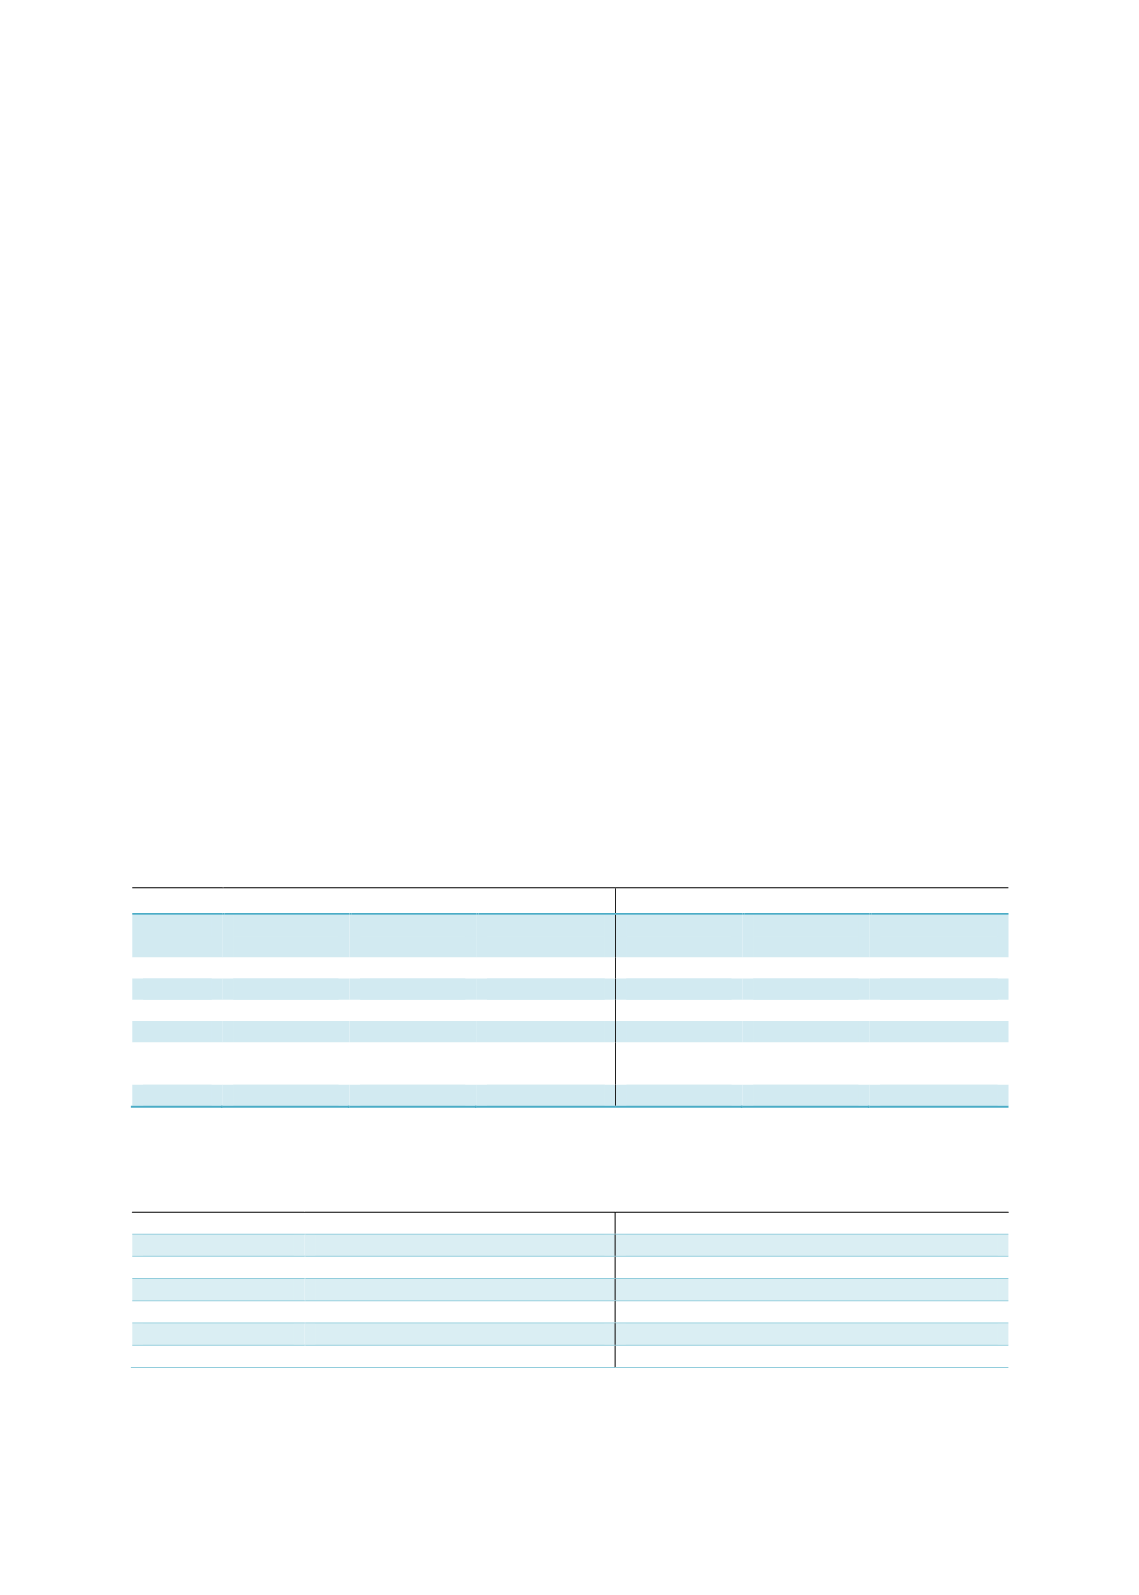
to GDP while Table 3.15 highlights the key indicators of financial intermediation by NBFIs as a
percentage of GDP in the GCC countries.
Table 3.14: Composition of Financial Markets by Country as a Percentage of GDP
Historical data
Data based on latest available date
Country
Outstanding
bond
Outstanding
loan
Market
Capitalization
Outstanding
bond
Outstanding
loan
Market
Capitalization
Bahrain
25.7%(2012) 40.0%(1990)
77.2% (1996) 94.5%(2016) 91.1%(2014)
60.9% (2016)
Kuwait
0.4% (2012) 96.5%(1995)
43.9% (1993)
6.2%(2016) 70.8%(2014)
105.4%(2006)
Oman
0.8% (2012) 13.9%(1980)
12.9% (1993) 22.8%(2016) 49.0%(2014)
35.1%(2016)
Qatar
23.3%(2012) 77.6%(1993)
119.8%(
2007) 49.3%(2016) 67
.7%(2014)
101.5%(2016)
Saudi
Arabia
1.7% (2012) 24.7%(1988)
74.2% (2009) 10.8%(2016) 55.8%(2014)
69.4% (2016)
UAE
9.7% (2012) 18.4%(1980)
20.4% (2003) 29.6%(2016) 90.3%(2014)
61.1% (2016)
Sources: World Bank, Bloomberg, The Global Economy
Note: Outstanding loans is defined as bank credit to the public and private sectors.
Table 3.15:
Key Indicators of Financial Intermediation by NBFIs as a Percentage of GDP
Country
NBFIs assets as % to GDP
Pension fund assets as % to GDP
Bahrain
31.5% (2014)
20.5% (2006)
Kuwait
2.44% (2014)
n/a
Oman
n/a
n/a
Qatar
n/a
n/a
Saudi Arabia
14.4% (2014)
26.0% (2016)
UAE
n/a
2.7% (2007)
Source: The Global Economy