


 143 / 247

122
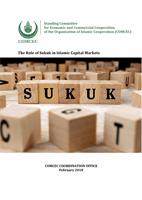
Chart 4.33: Indonesia’s Sovereign Sukuk vs Conventional Issuance (2006-June 2017)
0.00
5.00
10.00
15.00
20.00
25.00
30.00
35.00
40.00
45.00
50.00
2006
2007
2008
2009
2010
2011
2012
2013
2014
2015
2016 June 2017
USD billion
Sukuk issuance
Conventional issuance
USD47.4
billion
USD26.0
billion
USD14.7
billion
3.3
%
35.1
%
Sources: MOF, RAM
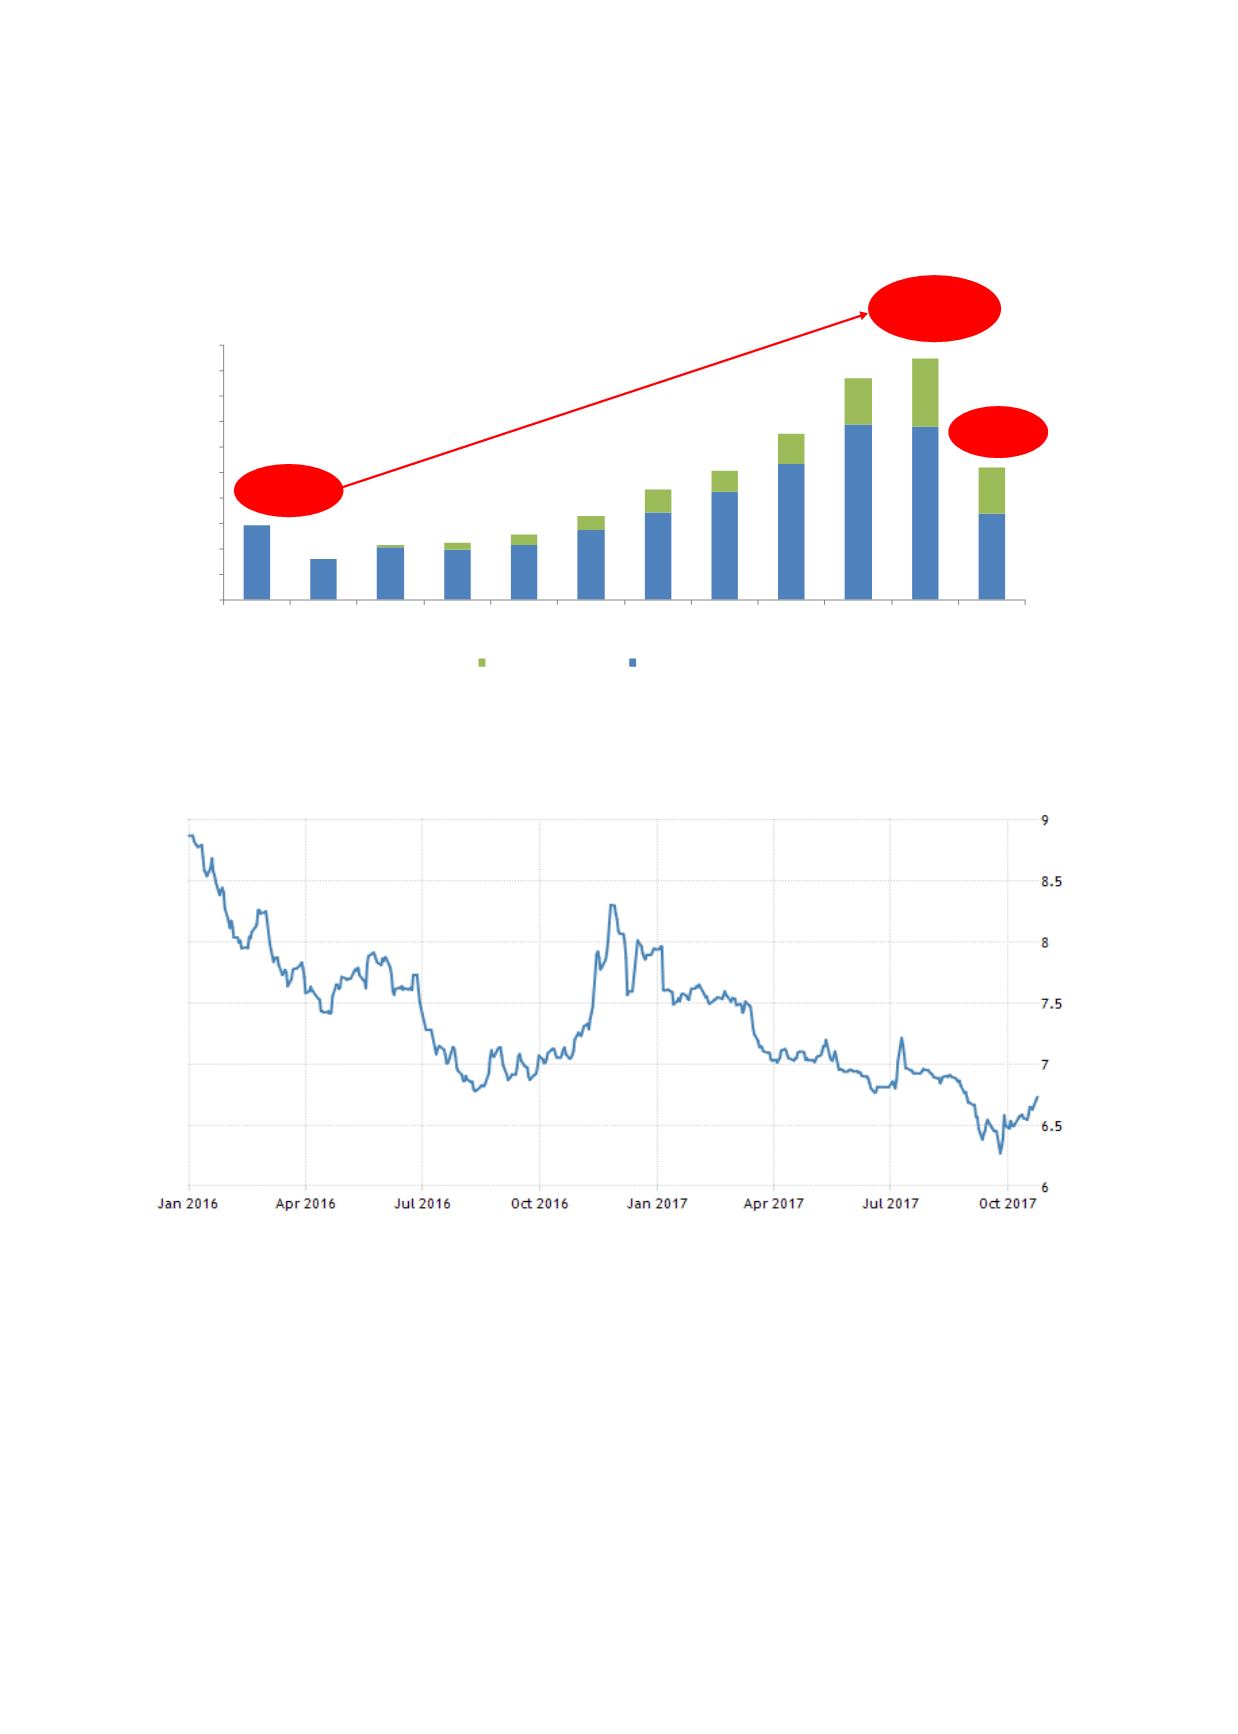
Chart 4.34: Indonesian 10-Year Sovereign Bond Yield
Sources: Indonesia Bond Pricing Agency, Trading Economics
In view of the government’s efforts to use sukuk in its national debt-management strategies, its
huge appetite vis-a-vis funding budget gaps and having to meet the development requirements
of infrastructure projects, the issuance of sovereign sukuk will increase rapidly in the
immediate term. Table 4.13 presents Indonesia’s budget deficits from 2014 to 2017.