


 26 / 151

Establishing Well Functioning National Trade Facilitation Bodies (NTFBs)
In the OIC Member States
14
OIC total
Group
Rank
WB
TAB
2007
Rank
WB
TAB
2015
Moveme
nt in
rank (up
+; down
-)
Rank
OIC
2015
Exports
Imports
Cost (USD) –
2015 only
Documents
Time
Documents
Time
Export Import
2006
2015
2006
2015
2006
2015
2006
2015
Jordan
78
54
+24
6
7
5
28
12
12
7
28
15
825
1235
Djibouti
148
56
+92
7
5
20
5
18
885
910
Oman
115
60
+55
8
9
7
23
10
13
8
27
9
765
700
Qatar
36**
61
-25
9
5
15
7
16
927
1050
Indonesia
60
62
-2
10
7
4
25
17
10
8
30
26
572
647
Bahrain
21**
64
-43
11
6
11
8
15
810
870
Gambia
24
77
-53
12
6
19
6
19
1040
745
Senegal
94
79
+15
13
6
6
6
12
10
6
26
14
1225
1940
Guyana
155
82
+73
14
8
6
42
19
11
7
54
22
730
720
Turkey
79
90
-11
15
9
7
20
13
13
8
25
14
990
1235
Saudi
Arabia
33
92
-59
16
5
6
36
13
9
8
44
17
1285
1309
Albania
101
95
+6
17
6
7
37
19
12
8
38
18
745
730
Lebanon
82
97
-15
18
6
4
22
22
12
7
34
30
1080
1365
Egypt
83
99
-16
19
8
8
27
12
9
10
135
82
625
3650
Suriname
43
106
-63
20
8
22
6
19
1050
1190
Source: World Bank
1.2.3.4.
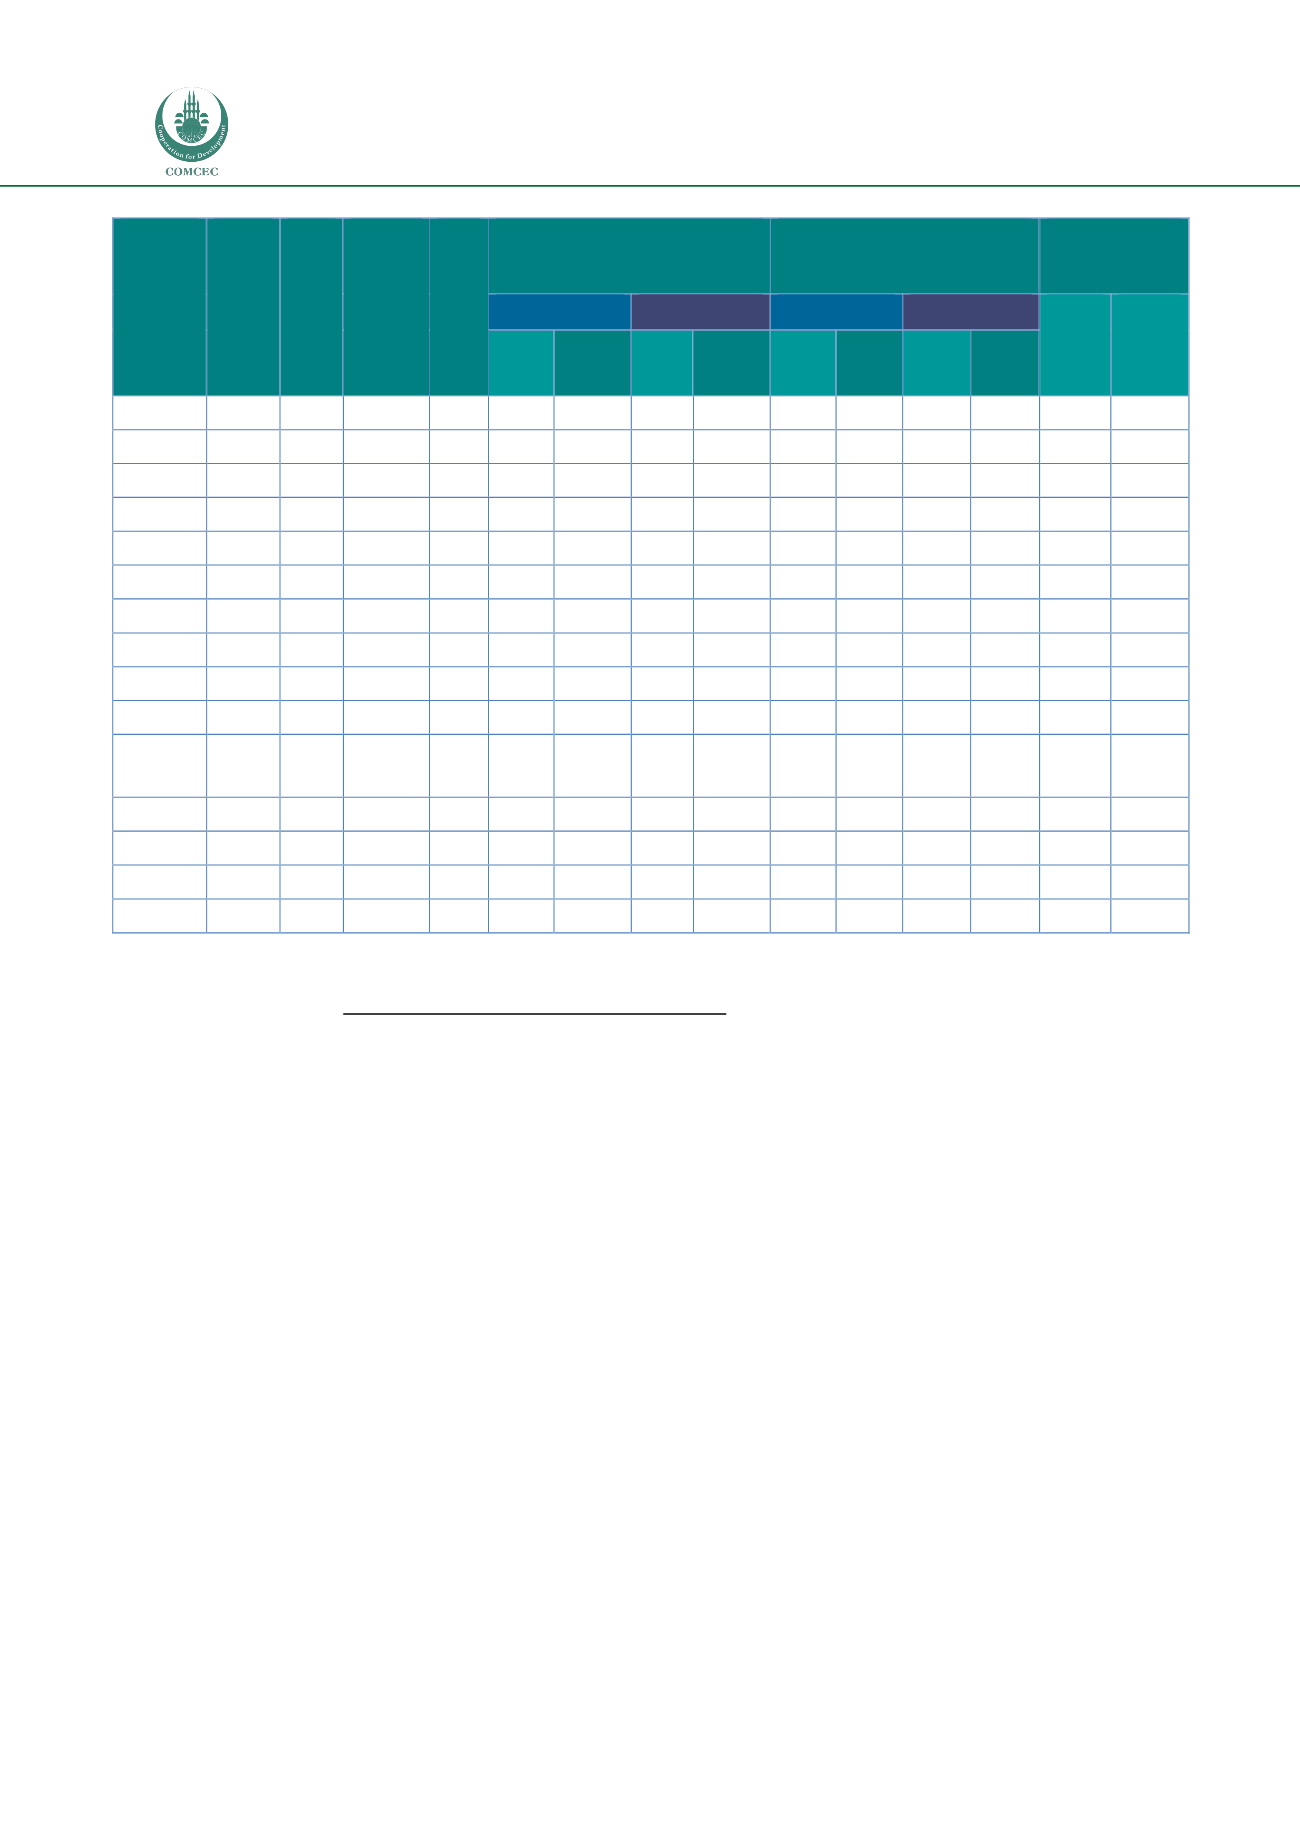
Regional analysis of OIC performance
The following table shows the 2015 ranking within OIC Members according to the World Bank (WB)
ranking of Trading Across Borders (TAB) when exporting and importing. Within the top 15 countries,
eight are from the Arab group, five from the Asian group, and two from the African group.
Meanwhile, in the bottom 15 countries, two belong to the Arab group, six to the Asian group, and
seven to the African group. Therefore, the Arab group is ranked as the best performer for doing
business when trading across borders, followed by the Asian group, and, finally, the African group.
Obviously, there are contrasts within the same regional group. This is the case in the Asian group,
where, on the one hand, Tajikistan is ranked as the most expensive country with 9,050 USD for
exporting and 10,650 USD for importing a container. On the other hand, the country with the lowest
costs is Malaysia, spending an average of 542.5 USD per container.
Annex 2 contains tables that set out the performance of, and information on, OIC Member State
countries according to their regional grouping (i.e., the Arab Group; the Asian Group; and the African
Group).
With respect to the Arab Group, the progress in terms of reduction in number of days for
export/import and documentary burden over the past 9 years (from 2006 to 2015) is noteworthy.
Moreover, with respect to the cost for import/export (in 2015), countries in the Arab Group are for