


 24 / 151

Establishing Well Functioning National Trade Facilitation Bodies (NTFBs)
In the OIC Member States
12
1.2.3.2.
TAB Index: Rankings at median point, median values, average scores, and
lowest ranking
In order to put the scores of top performers and OIC Member State countries in perspective, it is
useful to examine (i) the results of countries ranked at the median line (in overall terms); (ii) the
median values for each individual indicator; (iii) the average scores for the three indicators; and (iv)
the score of the country with the lowest ranking. The following table sets out this information.
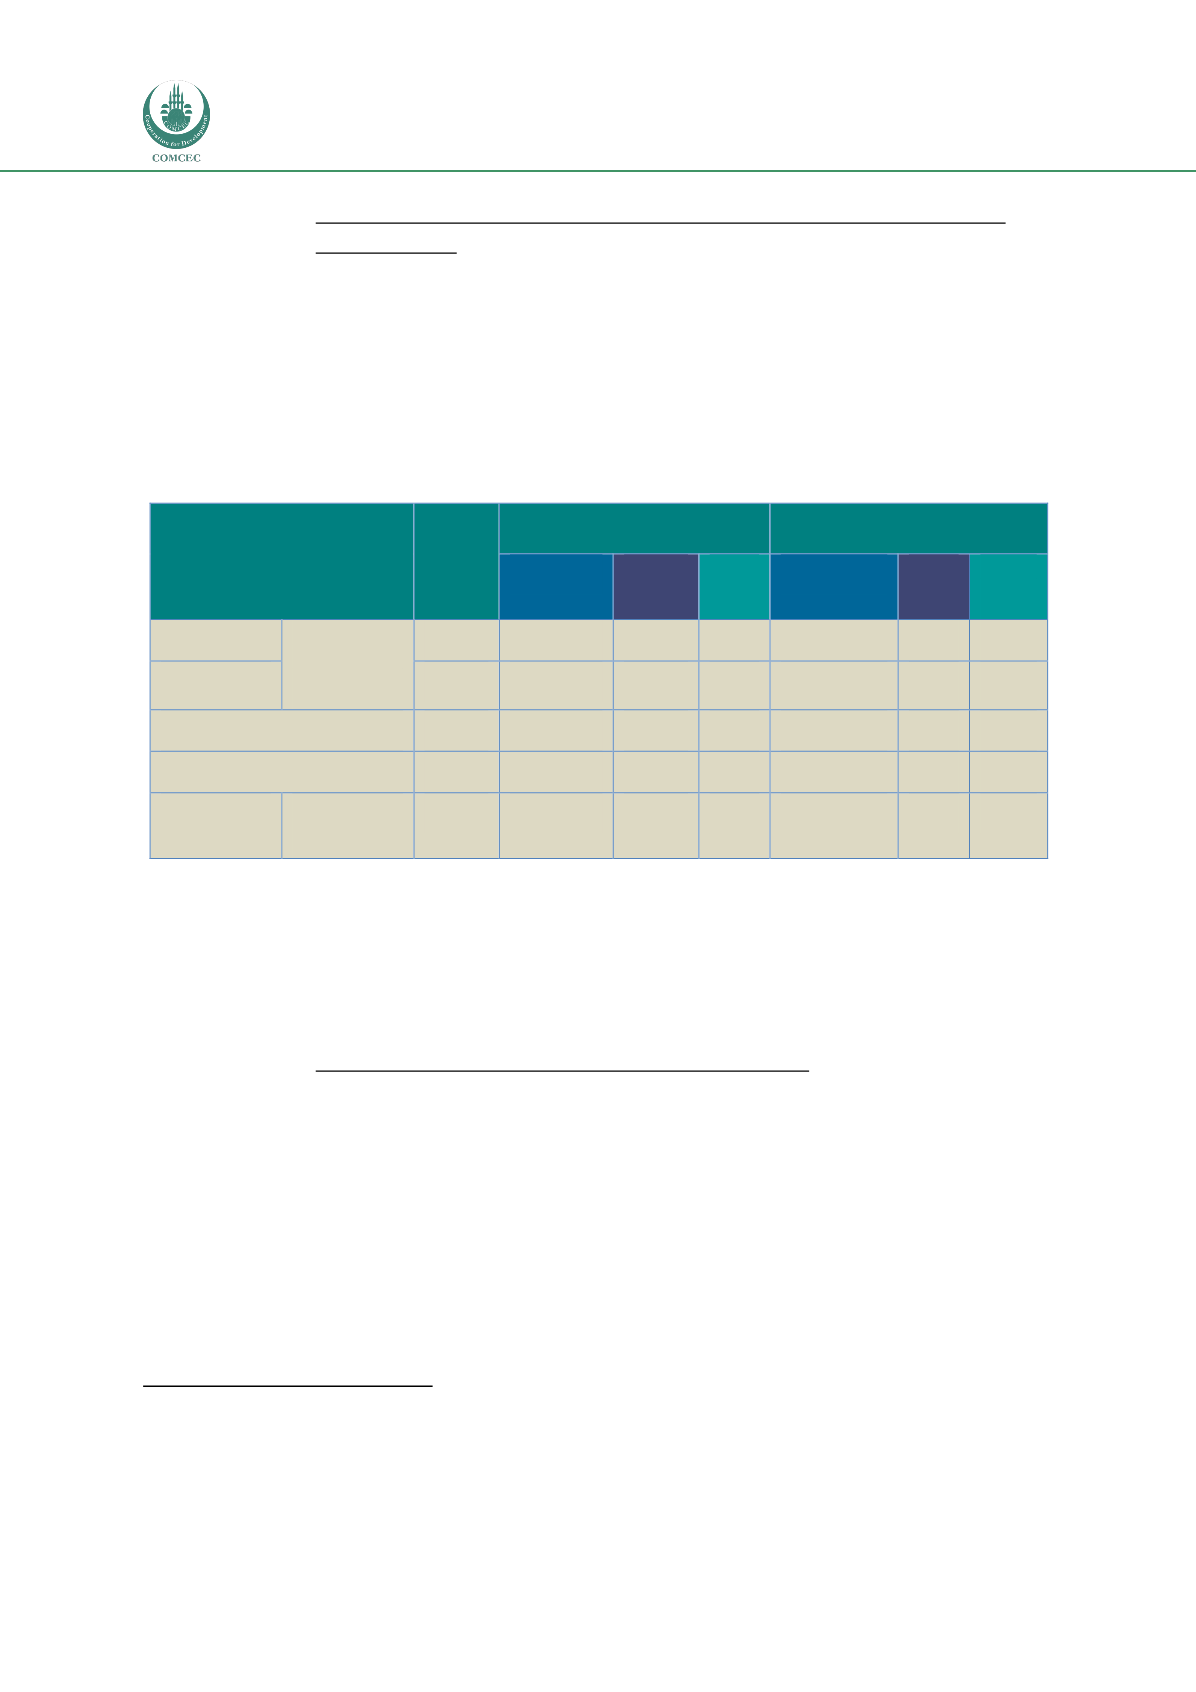
Table 2: Median and average values of indicators and countries with overall lowest and
median rankings
WTO Members
Rank
WB Tab
2015
Exports 2015
Imports 2015
Documents Time/D
ays
Cost
USD
Documents
Time
/Days
Cost
USD
Timor-Leste
Countries at
median point
(overall)
94
6
28
410
7
26
415
Albania
95
7
19
745
8
18
730
Median for each indicator
n/a
6
17
1,200
7
19
1,420
Average scores
n/a
6
22
1,560
7
24
1,877
Uzbekistan
Lowest
ranking
189
11
54
5,090
13
104
6,452
Source: World Bank
It is noteworthy that the average and median scores for documents required for export/import are
the same, whereas the averages for the other two indicators are larger than the median values,
suggesting that a number of countries with high costs and heavy documentary requirements are
raising the averages
15
and the median scores may be better yardsticks for comparison purposes.
1.2.3.3.
General observations and the top 20 OIC performers
Table 3 presents data on the 20 OIC Member State countries that are currently most highly ranked by
the WB TAB index.
16
A number of observations can be made in relation to the performance of 54 OIC Member State
countries in the TAB Index.
First, of the 54 OIC Member State countries covered by the index, only 16 of them fall within the top
50% of performers overall. In other words, a somewhat disproportionate number of OIC Member
15
For example, an analysis of the data suggests that the cost to export exceeds USD2,000 in only 34 of the 189 countries reviewed (of
those 34 countries, three of the countries have a final overall ranking above the 153rd place) and the cost to import exceeds
USD2,000 in 50 of the 189 countries reviewed (of those 50 countries, 16 of the countries have a final overall ranking above the 153rd
place).
16
Note two tables providing this information for all OIC Member State countries are contained in Annex 1.