


 21 / 151

Establishing Well Functioning National Trade Facilitation Bodies (NTFBs)
In the OIC Member States
9
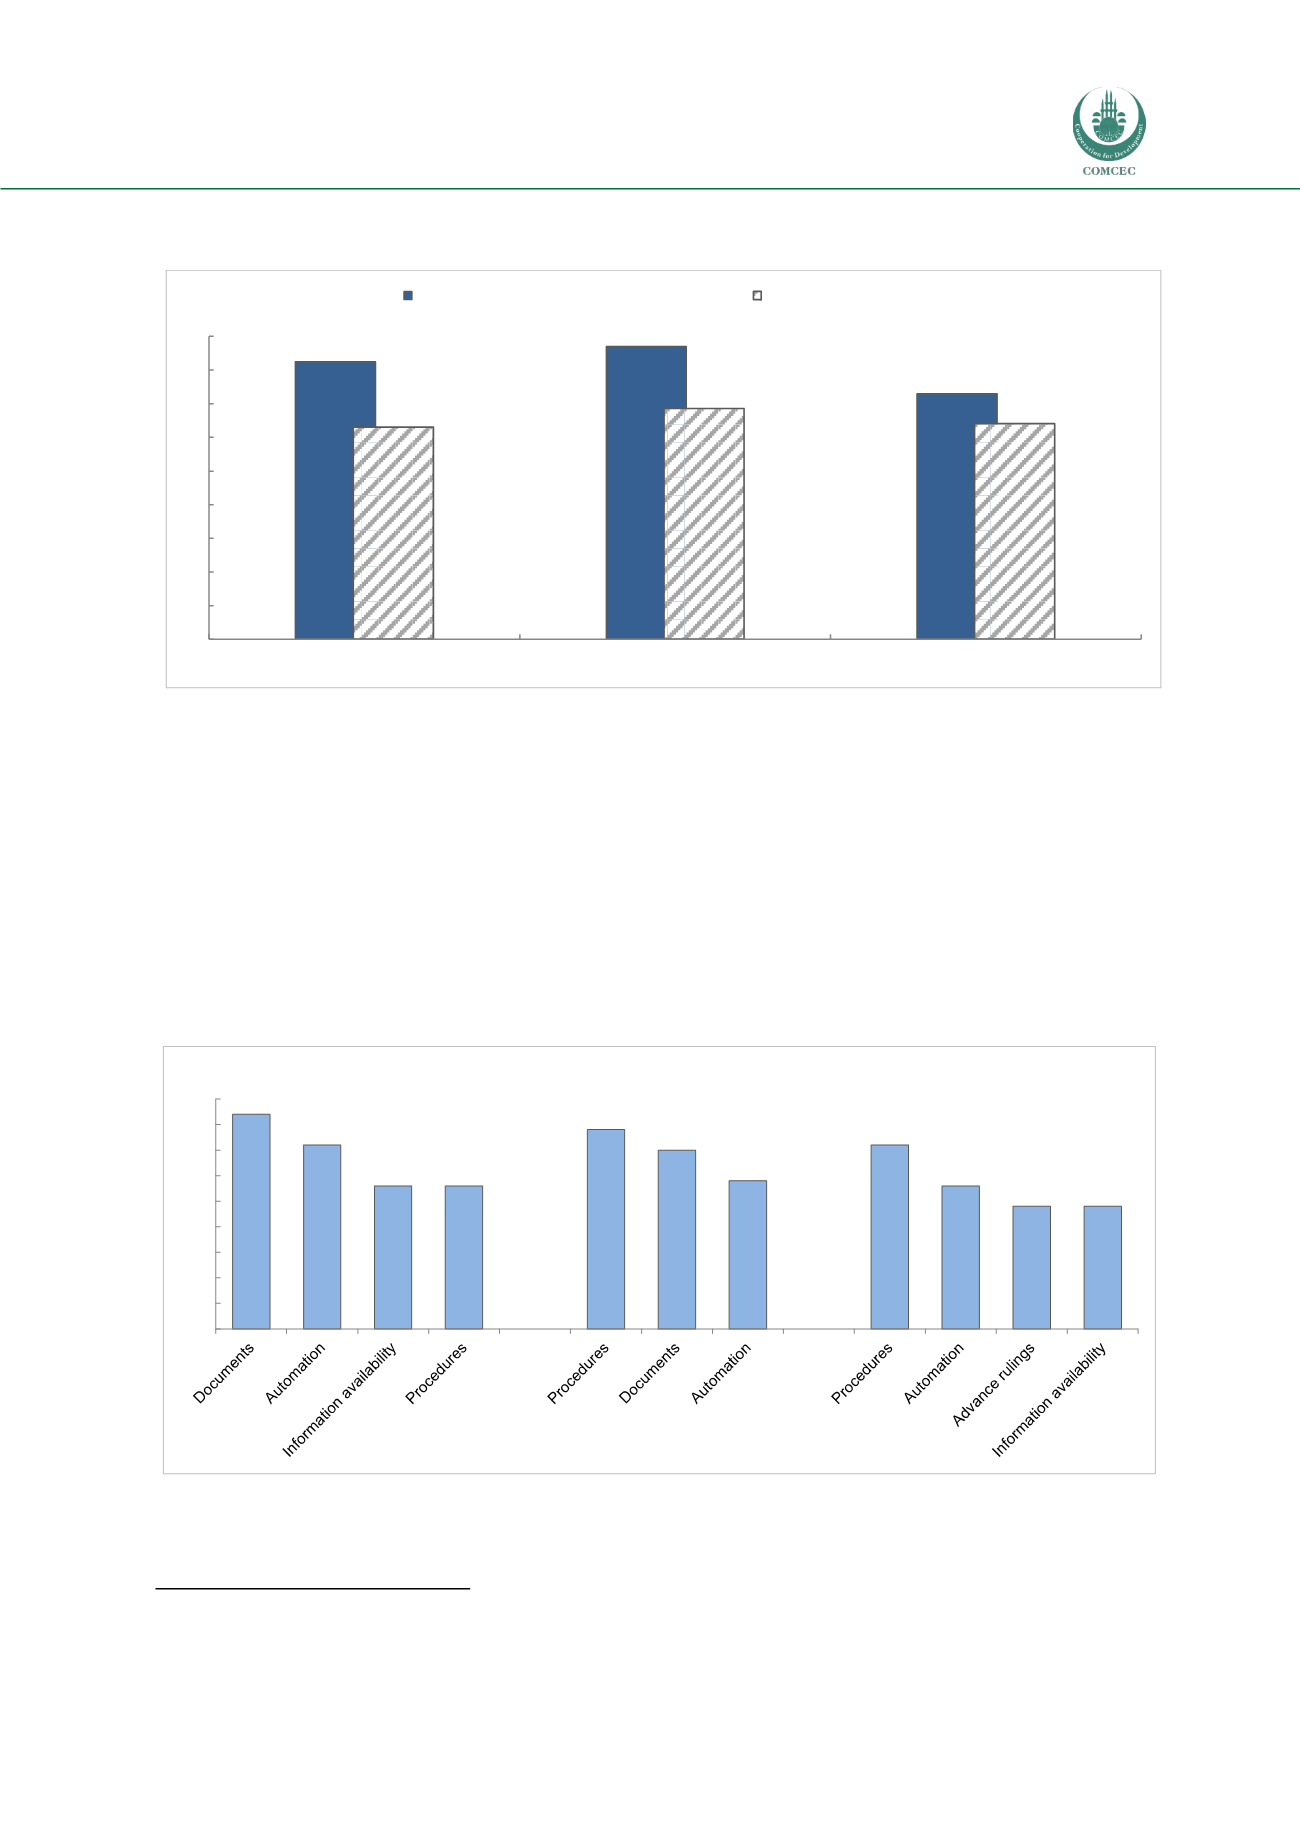
Figure 1: Level of TFA Implementation
Source: OECD
The OECD has also estimated the impacts of different types of trade facilitation measures in terms of
reducing costs and prepared the following helpful figure in this respect.
8
As indicated previously
NTFBs have a role in successfully implementing all of the following types of measures: harmonisation
and simplification of trade documents; automation of trade and customs processes; making trade-
related information available; and the streamlining of border procedures.
Figure 2: Level of Development and Costs of implementing Trade Facilitation Measures (%)
Source: OECD
8
Ibid.
Figure 1. Overall potential trade cost reductions by income group
What t rade f acilit at ion measures are est imat ed t o have t he great est impact ?
Improvement s in t he area of
formalities
(simplif icat ion of t rad docu ent s;
st ream lin ing of border procedures; and a t omat ion of t he border proc ss) appear t o
have t he great st impact on t rade c s s, generat ing cost savings of 2.8% t o 4.2%
depending on t he level of development . Ot her policy areas t hat have an import an t
pot ent ial for cost reduct ions are t he availabilit y of t rade-relat ed informat ion and t he
possibilit y t o request advance ru lings.
For low income count ries t he measures wit h t he pot ent ial t o most reduce t rade cost s
are: harmon ising and simplif ying t rade document s (4.2%); au t omat ing t rade and
cust oms processes (3.6%); ensuring t he availabilit y of t rade-relat ed informat ion (2.8%)
and st ream lin ing border procedures (2.8%).
For lower m iddle income count ries, st ream lining border procedures are est imat ed t o
have t he great est impact (3.9%), while harmonising and simplifying t rade document s
and aut omat ing t rade and cust oms procedures wou ld reduce cost s by 3.5% and 2.9%
respect ively.
For upper m iddle income count ries t he measures wit h t he great est expect ed impact
on t rade cost s are st ream lin ing border procedures (3.6%), au t omat ing t rade and
cust oms processes (2.8%), ensuring t he availabilit y of t rade-relat ed informat ion
(2.4%) and providing advance ru lings on cust oms mat t ers (2.4%)
Figure 2. Potential trade cost reductions by measure
16.5
17.4
14.6
12.6
13.7
12.8
0
2
4
6
8
10
12
14
16
18
Low income countries
Lower-middle income countries
Upper-middle income countries
%
"Full" implementation
"Limited" implementation
0.0
0.5
1.0
1.5
2.0
2.5
3.0
3.5
4.0
4.5
%
Low income countries
Lower-middle income countries
Upper-middle income countries
www.oecd.org/tradetad.contact@oecd.org
@OECDtrade
June 2015
What t rade f acilit at ion measures are est imat ed t o have t he great est impact ?
Improvement s in t he area of
formalities
(simplificat ion of t rade document s;
st ream lin ing of border procedures; and aut omat ion of t he border process) appear t o
have t he great est impact on t rade cost s, generat ing cost savings of 2.8% t o 4.2%
depending on t he level of development . Ot her policy areas t hat have an import an t
pot ent ial for cost reduct ions are t he availabilit y of t rade-relat ed informat ion and t he
possibilit y t o request advance ru lings.
For low income count ries t he measures wit h t he pot ent ial t o most reduce t rade cost s
are: harmon ising and simplifying t rade document s (4.2%); aut omat ing t rade and
cust oms processes (3.6%); ensuring t he availabilit y of t rade-relat ed informat ion (2.8%)
and st ream lining border procedures (2.8%).
For lower m iddle income count ries, st ream lining border procedures are est imat ed t o
have t he great est impact (3.9%), while harmonising and simplifying t rade docu ent s
and aut omat ing t ra e and cust oms procedu res wou ld reduce cost s by 3.5% nd 2.9%
resp ct ively.
For upper m id le income count ries t he measu es wit h t he great est expect ed imp ct
on t rade cost s are st ream lining border procedures (3.6%), au t omat ing t rade and
cust oms processes (2.8%), ensuring t he availabilit y of t rade-relat ed informat ion
(2.4%) and providing advance ru lings on cust oms mat t ers (2.4%)
Figure 2. Potential trade cost reductions by measure
16.5
17.4
14.6
12.6
13.7
12.8
0
2
4
6
8
10
12
14
16
18
Low income countries
Lower-middle income countries
Upper-middle income countries
0.0
0.5
1.0
1.5
2.0
2.5
3.0
3.5
4.0
4.5
%
Low income countries
Lower-middle income countries
Upper-middle income countries