


 23 / 151

Establishing Well Functioning National Trade Facilitation Bodies (NTFBs)
In the OIC Member States
11
1.2.3.
The World Bank’s Trading Across Borders (TAB) Index: The positive effect of
implementing trade facilitation measures
The World Bank’s
Doing Business: Trading Across Borders
initiative measures “the time and cost
(excluding tariffs) associated with exporting and importing a standardized cargo of goods by sea
transport”.
13
The Trading Across Borders (TAB) index in the Doing Business (DB) publication of the
World Bank (WB) ranks 189 countries in terms of their performance in this regard – on the basis of
three indicators (documents required to import/export; time required; and cost) taking account of
their distance to frontiers.
14
Thus the index is a useful reference to gage the relative impact of trade
facilitation measures on trading costs.
A review of the index suggests that the implementation of trade facilitation measures (such as
rationalisation of documentary requirements and time spent at borders) has had a positive impact
for businesses around the globe, including for OIC countries. The following subsections review the
indicators relating to those countries ranked by the index as top performers as well as the ranking of
OIC Member State countries. The following subsections also reference the average and median
scores for these indicators because they are particularly useful to gage the relative performance of
the countries.
1.2.3.1.
TAB Index: Top performers overall
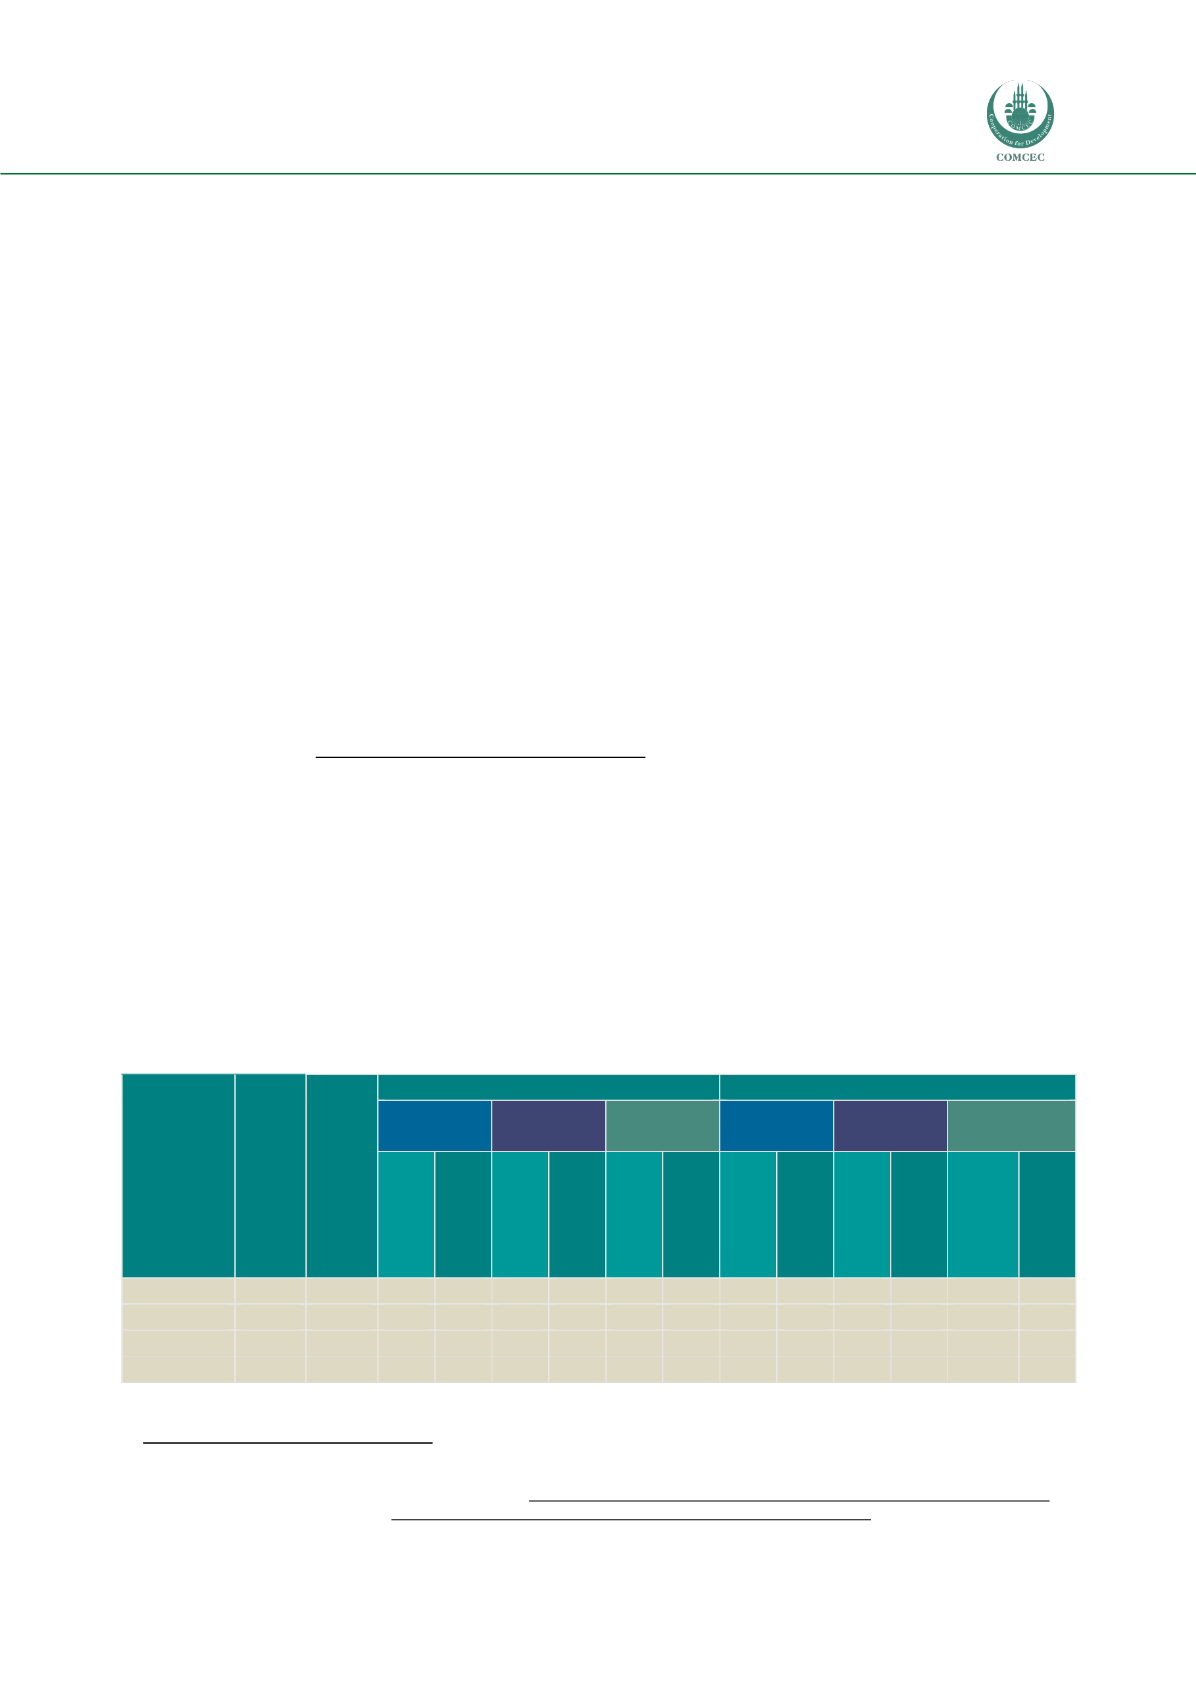
The following table shows the top four countries according to the ranking provided by the WB TAB.
Specifically, it shows the progress made from 2006 to 2015 in terms of rationalising documentary
requirements and the time required to export and import. Notably, the reduction in the number of
days required to export and import appears to have been the most significant factor resulting in the
top ranking.
The indicators of these world’s best performers can serve as a benchmark for OIC Member State
countries and be used as a goal to be attained in terms of improved trade facilitation measures.
Table 1: Top Cases WB TAB 2007&2015
WTO
Members
Rank
WB
TAB
2015
(from
189)
Rank
WB
TAB
2007
(from
170)
Exports
Imports
Document
s
Time/Days
Costs
Document
s
Time/Days
Costs
2007 2015 2007 2015
2007
2015 2007 2015 2007 2015
2007
2015
Singapore
1
4
5
3
6
6
382
460
6
3
3
4
333
440
Hong Kong
2
1
2
3
6
6
425
590
2
3
5
5
425
565
Korea
3
28
5
3
12
8
780
670
8
3
12
7
1040
695
Sweden
4
9
4
3
6
9
831
725
3
3
6
6
831
735
Source: World Bank
13
World Bank, Doing Business: Trading Across Borders
, http://www.doingbusiness.org/data/exploretopics/trading-across-borders.14
For the DB TAB methodology see
, http://www.doingbusiness.org/methodology/trading-across-borders.