


 25 / 151

Establishing Well Functioning National Trade Facilitation Bodies (NTFBs)
In the OIC Member States
13
State countries (approximately 66% of them) are ranked in the lower 50% overall. This suggests that
there is a large room for the improvement for the OIC Member Countries.
Second, in terms of progress in moving up the index, table 3 indicates that half OIC Member State
countries that were most highly ranked in 2015 have actually dropped their rank since the collection
of the last set of data, where half of them moved up in rank (sometimes making significant jumps up
the ranking). Of course the index is only illustrates the relative rank/performance of countries (i.e.,
when ranked in comparison to other countries). Thus, in certain instances, the introduction of
measures that are increasingly trade facilitative may not translate into a movement up the ranking.
However, the, information contained in the following table illustrates how the streamlining of
documentary requirements and reduction in the time required for import/export appears (in
general) to affect the countries ranking.
Finally, as indicated elsewhere, the three indicators considered cumulatively dictate the ranking and
thus a country’s positive performance in one field may be offset by a relatively poorer performance
in another field, and vice versa. This is illustrated when one examines the following table with the
median and average values (set out in above sub-section) in mind.
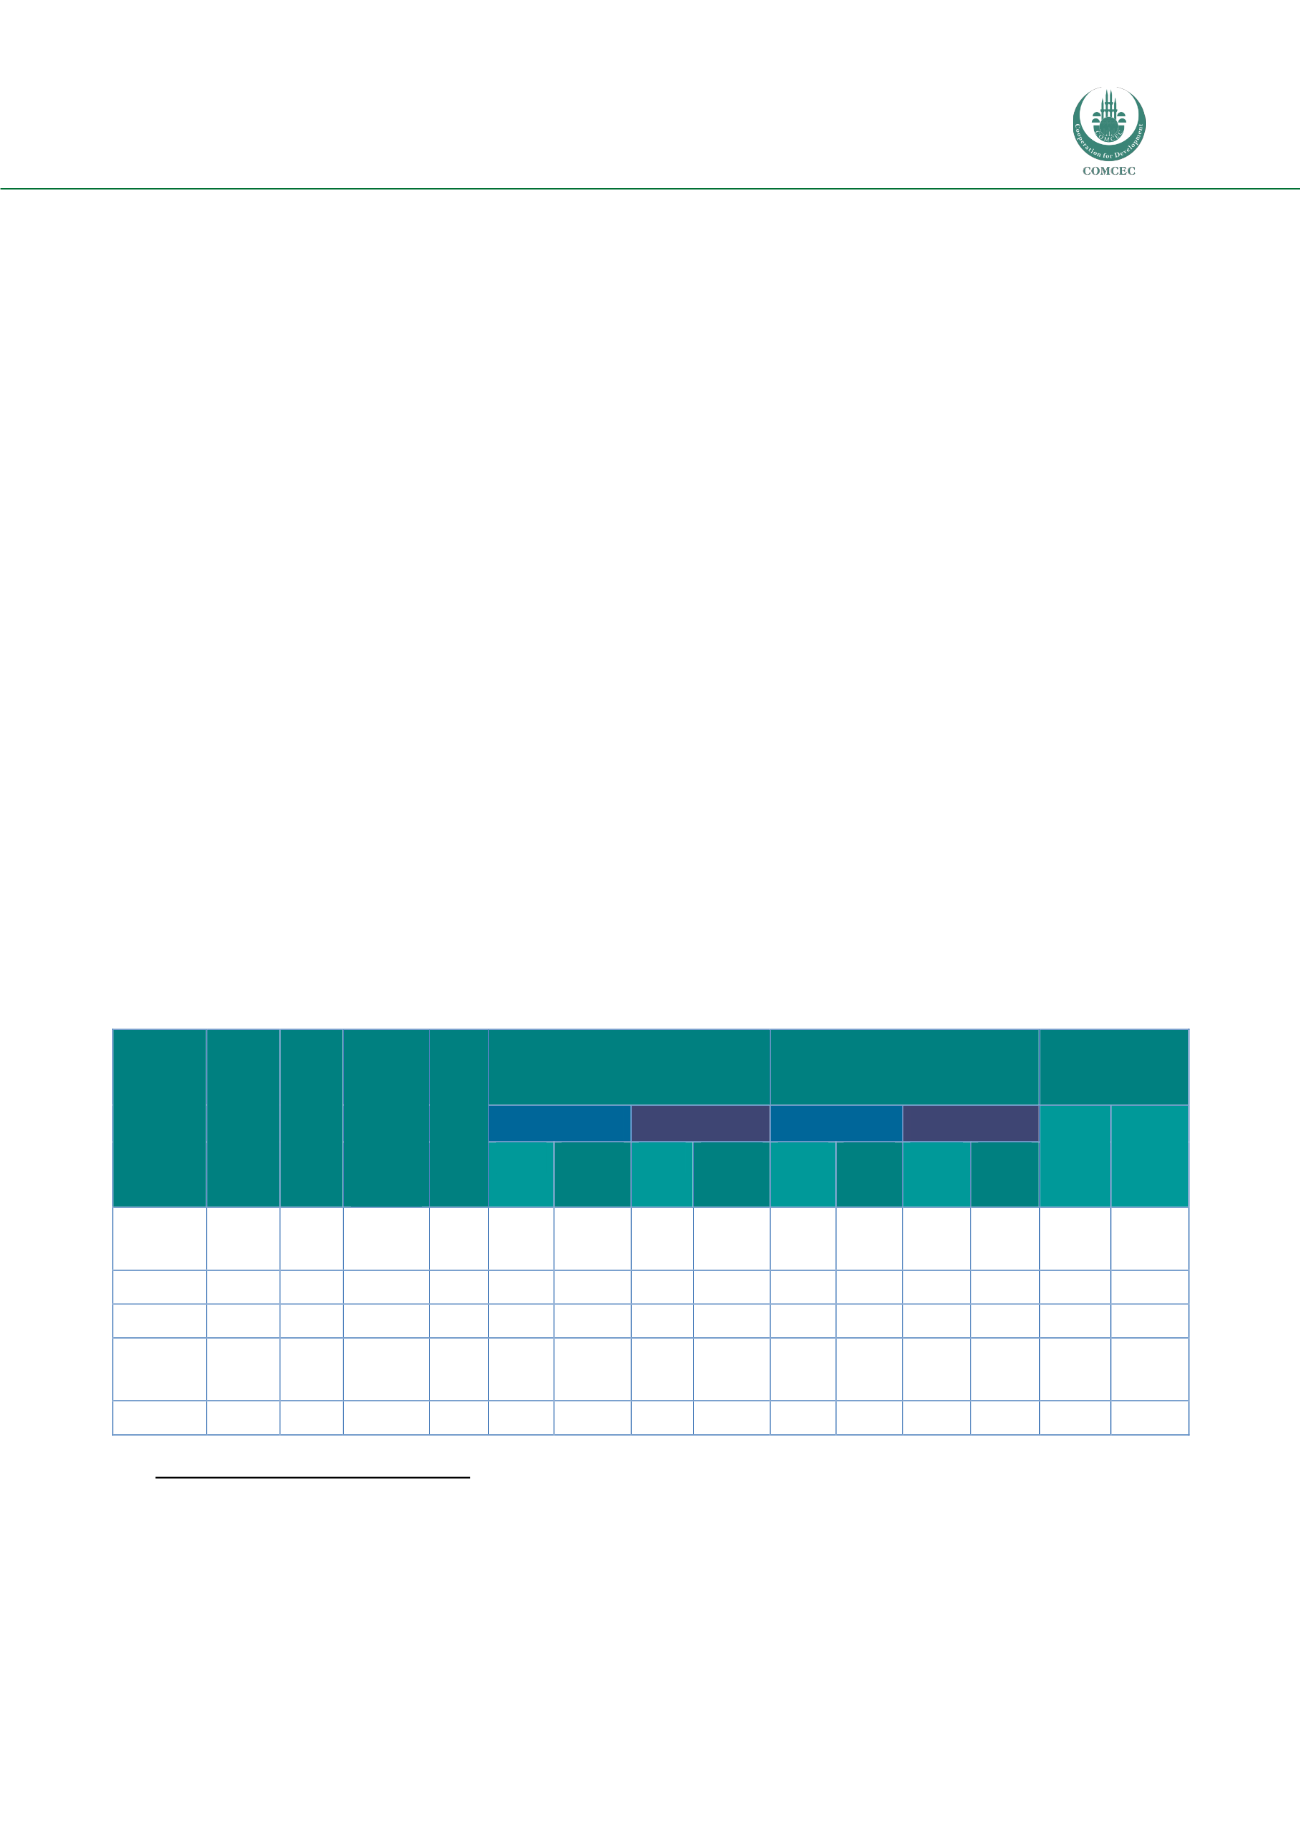
The following table shows the changes in OIC Member State countries' ranking according to the WB
TAB index of the Doing Business publications in 2007 and 2015. The second and third columns
highlight the evolution of OIC Members in Trading Across Borders (TAB), and the fourth column
shows where they are found to be up-to-date with other OIC Members. The following columns
specify the criteria for the 2015 classification. The data for 2006 shows the point of departure for
these countries, because in that year no TAB ranking yet existed.
17
Table 3: Change of WB Tab Index Rankings for the OIC Member Countries 2007 & 2015
OIC total
Group
Rank
WB
TAB
2007
Rank
WB
TAB
2015
Moveme
nt in
rank (up
+; down
-)
Rank
OIC
2015
Exports
Imports
Cost (USD) –
2015 only
Documents
Time
Documents
Time
Export Import
2006
2015
2006
2015
2006
2015
2006
2015
United Arab
Emirates
10
8
+3
1
6
3
18
7
6
5
18
7
665
625
Malaysia
46
11
+35
2
6
4
20
11
12
4
22
8
525
560
Morocco
77
31
+46
3
7
4
31
10
11
6
33
14
595
970
Brunei
Darussalam
36*
46
-10
4
5
19
5
15
705
770
Tunisia
39
50
-11
5
5
4
25
16
8
6
33
20
805
910
17
Please note that Palestine, Turkmenistan, and Somalia are OIC Members, but are not included in the data that the WB Doing
Business 2015 provides.
*Data for 2008
**Data for 2009
*** Data for 2014