


 103 / 231

Diversification of Islamic Financial Insturments
89
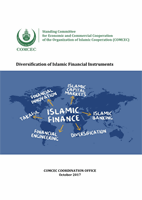
Table 39. Total Deposits in Local Currency 2015 (in million USD)
Depositors
Demand deposits
Savings and investments
deposits
Federal and state gov.
158.7
108.1
Public enterprises
149.1
142.3
Private sector
3728.8
4014.1
Total
4110.6
4264.5
Grand Total
8375
Deposit/GDP
9%
Source: Central Bank of Sudan
Finances
In Sudan finance is provided by Islamic banks according to the economic activity and according
to the Islamic mode of financing. The following Table (Stocks of Banking Finance) presents the
stock of finance in local and foreign currencies provided to different economic sectors in
Sudan. The banking finance includes finance extended by the operating banks to the private
sector, public enterprises and to the state and local governments.
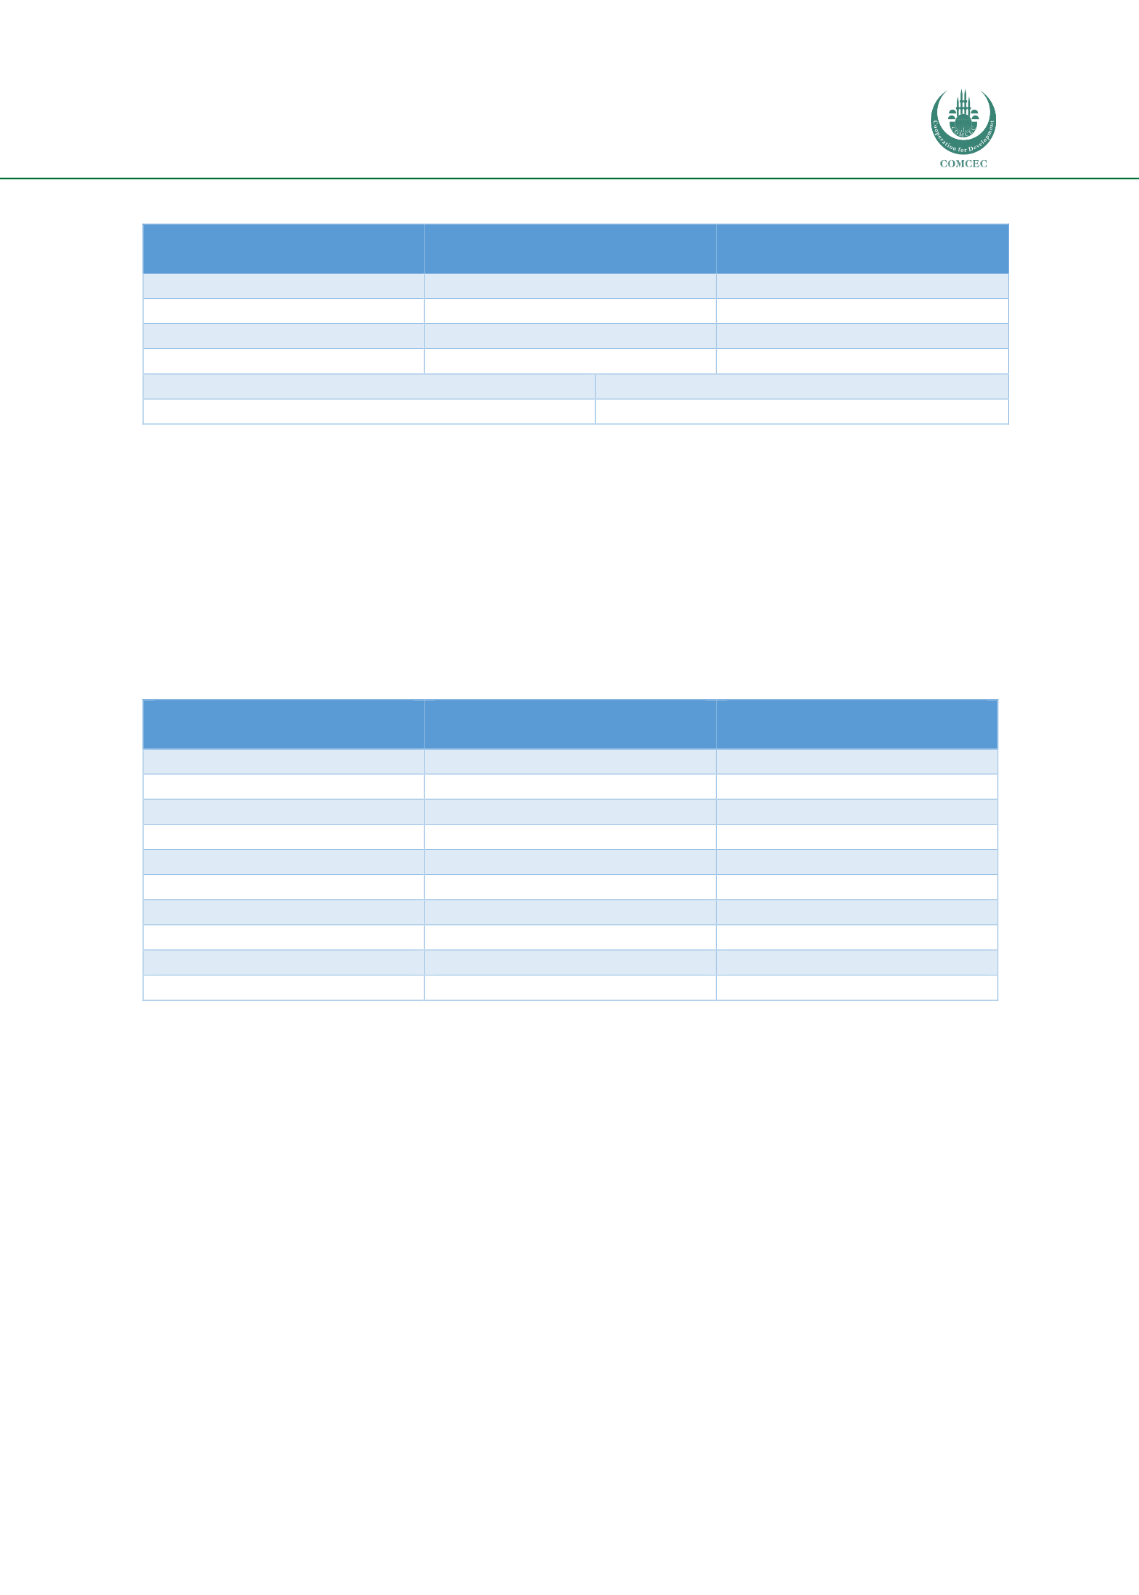
Table 40.
Stock of Banking Finance by Economic Activities in Local and Foreign Currency 2015
Sector
Stock of finance
(in millions USD)
%
Agriculture
1428.8
16.0
Manufacturing
1276.2
14.3
Exports
230.5
2.6
Transportation and storage
669.2
7.5
Local trade
988.3
11.1
Imports
240.4
2.7
Construction
1610.1
18.1
Mining
51.9
0.6
Services
2414.2
27.1
Total (stock)
8909.33
100
Source: Central Bank of Sudan
.
In 2015 the stock exceeded 8.9 billion USD where services sectors (telecommunication,
medical services
etc.) received 27.1% of the total finance in local currency. This is followed by
the construction sector 18.1% and the agriculture sector (16 %). Regarding the mode of
finance, the Table below shows the Flow of Islamic banking finance during 2015.
The flow exceeded 9 billion USD. As realized it is dominated by Murabahah mode as the case
in all jurisdictions that practice Islamic finance (almost 50% compared to 30% in Malaysia),
however, according to Central Bank of Sudan, it’s decreasing through years because of the
Bank’s policy in encouraging banks using other modes.