


 21 / 127

Barriers and Opportunities for Enhancing Capital Flows
In the COMCEC Member Countries
13
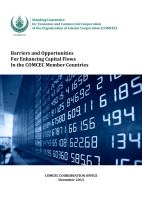
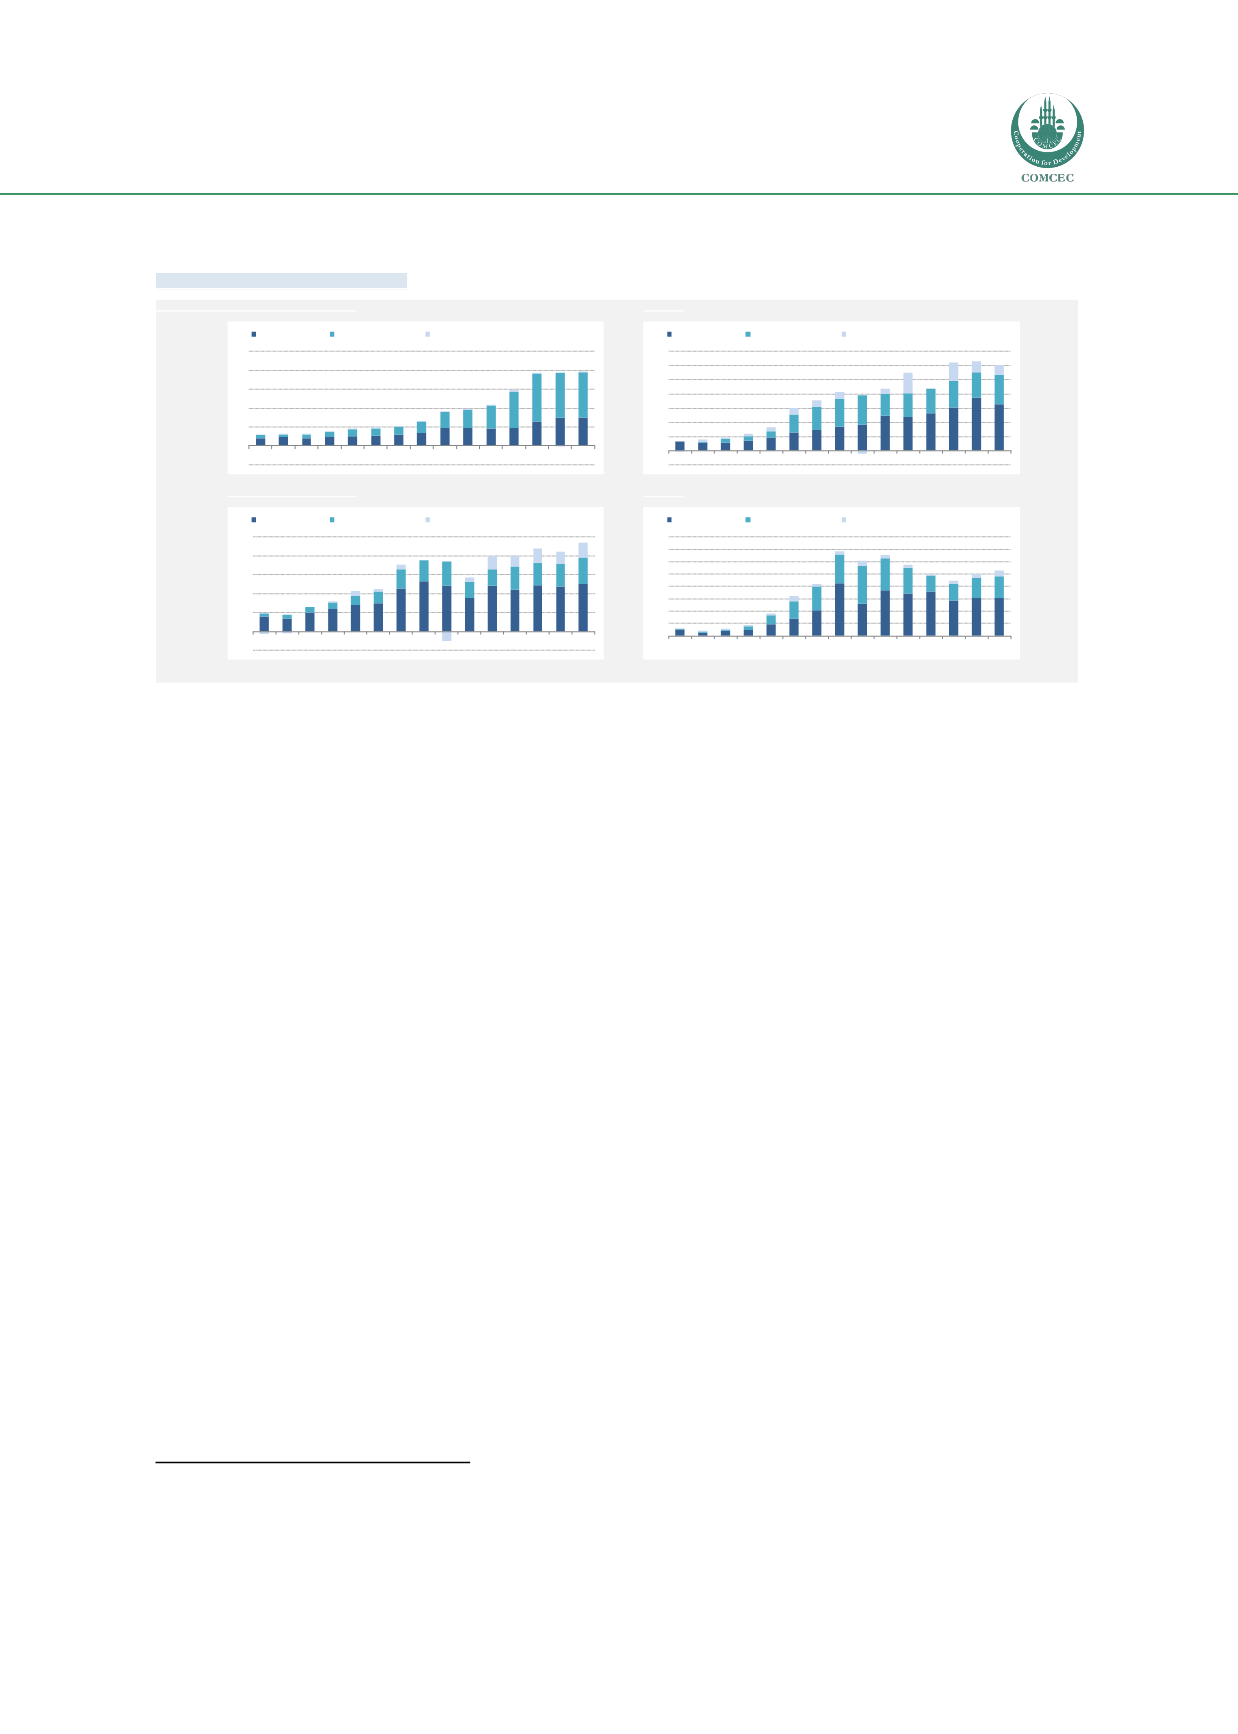
Figure 1.4: Composition of total capital inflows by income group, 2000-2014
9
Source: EIU Country Data
1.2.
TRENDS AMONG COUNTRY INCOME GROUPS
The COMCEC Member States in each of the four World Bank income groups form broadly
homogeneous sets of countries, though with some differing characteristics, such as the level of
natural resource endowment, level of political stability, or the development of the banking
system. Least heterogeneous are the low-income and high-income groups, which have a large
proportion of countries that are situated in the same geographical region and that share
numerous socio-economic characteristics. For example, most nations in the low-income group
are in Sub-Saharan Africa (SSA); all but one of the countries in the high-income group are
hydrocarbon-exporting members of the Gulf Cooperation Council (GCC).
Low-Income Countries (LICs)
10
Of the 17 countries in the low-income group, 13 are situated in SSA (the four that lie outside
SSA are Afghanistan, Bangladesh, Kyrgyz Republic and Tajikistan). Compared with the other
income groups, countries in the low-income group have tended to receive barely a fraction of
global capital inflows (see Figure 1.3 and Figure 1.4).
Within SSA as a whole, it is possible to identify a number of notable trends in the last ten years
that characterise the changing nature of private capital flows in the region:
Inward FDI flows to SSA increased to about $37bn in 2011 from less than US$15bn in
2001, according to data from the United Nations Conference on Trade and
9
Excludes IMF credit; includes EIU forecasts for 2013 and 2014
10
Afghanistan, Bangladesh, Benin, Burkina Faso, Chad, Comoros, The Gambia, Guinea, Guinea Bissau, Kyrgyz Republic, Mali,
Mozambique, Niger, Sierra Leone, Somalia, Tajikistan, Togo, Uganda
INCOME GROUPCOMPOSITION
LowIncome Group
LowMiddle Income Group
UpperMiddle Income Group
High Income Group
-5
0
5
10
15
20
25
2000 2001 2002 2003 2004 2005 2006 2007 2008 2009 2010 2011 2012 2013 2014
M& LT debt inflows Inwarddirect investment Inwardportfolio investment (net of fc bonds)
-20
0
20
40
60
80
100
120
140
2000 2001 2002 2003 2004 2005 2006 2007 2008 2009 2010 2011 2012 2013 2014
M& LT debt inflows Inwarddirect investment Inwardportfolio investment (net of fc bonds)
-50
0
50
100
150
200
250
2000 2001 2002 2003 2004 2005 2006 2007 2008 2009 2010 2011 2012 2013 2014
M& LT debt inflows Inwarddirect investment Inwardportfolio investment (net of fc bonds)
0
20
40
60
80
100
120
140
160
2000 2001 2002 2003 2004 2005 2006 2007 2008 2009 2010 2011 2012 2013 2014
M& LT debt inflows Inwarddirect investment Inwardportfolio investment (net of fc bonds)