


 27 / 127

Barriers and Opportunities for Enhancing Capital Flows
In the COMCEC Member Countries
19
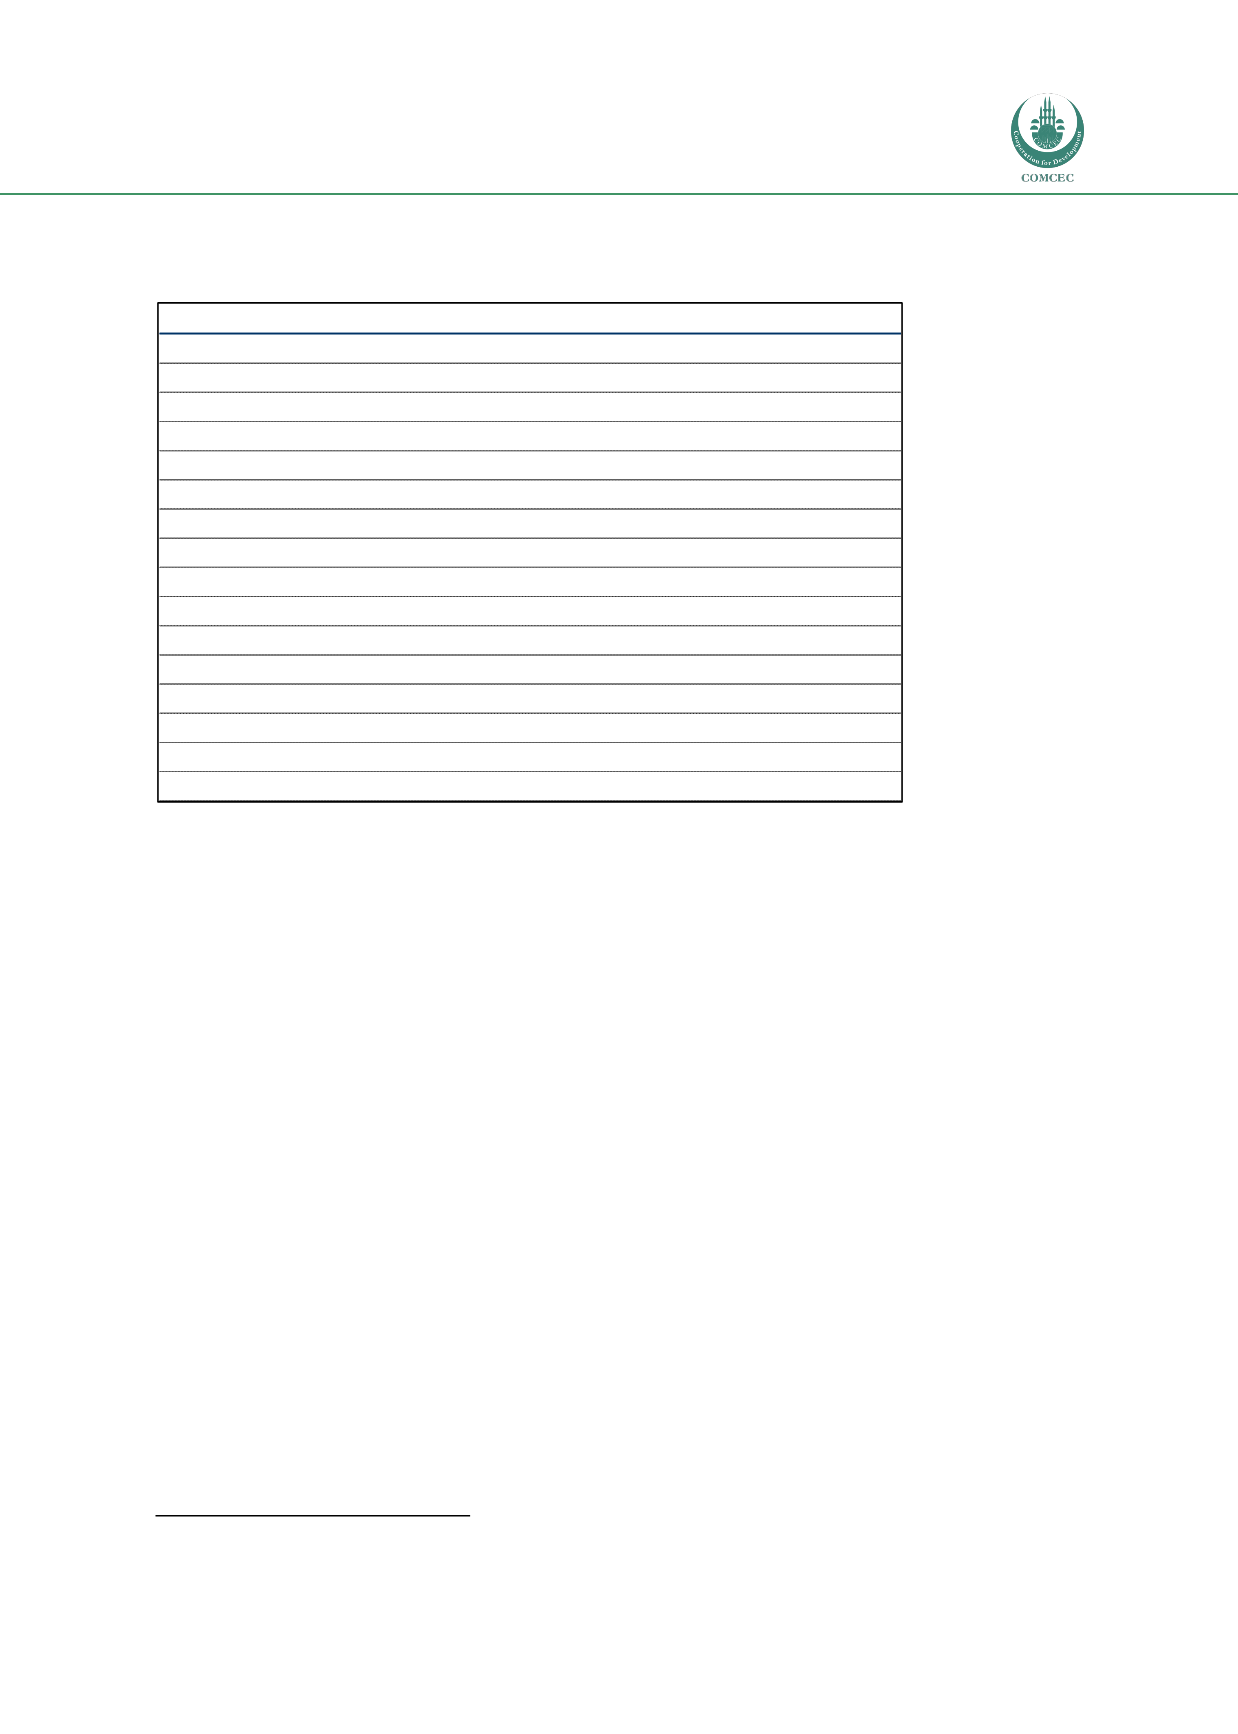
Figure 1.8: Magnitude of FDI flows by range for COMCEC Member Countries within the
upper-middle income group, 2012
Source: UNCTAD World Investment Report 2013
High-Income Countries (HICs)
24
All countries in the high-income group except Brunei belong to the GCC. These GCC economies
are enjoying high economic growth on the back of historically high oil prices, expanded oil
production, expansionary fiscal policies, and low interest rates. At the same time, however, the
economies remain dependent on hydrocarbon extraction, while rising government spending
has raised breakeven oil prices, implying heightened vulnerabilities. A number of patterns can
be identified among countries in this group.
The pattern of capital flows – particularly FDI – has been somewhat volatile over the
past decade for GCC economies. For example, from 2000 to 2008 net investments by
the GCC abroad were higher than net investments by foreigners in the GCC. As
elsewhere, inflows into GCC countries have been affected by global conditions. In 2007,
GCC countries’ inward FDI peaked. In return, Bahrain, Kuwait, Qatar, Saudi Arabia and
the UAE invested as much abroad as they received in the form of inward FDI.
-
According to UNCTAD, annual FDI inflows to the GCC averaged 6% of GDP between
2005 and 2011. Although data on the geographical distribution of inward FDI are
limited, available data for Kuwait and Saudi Arabia suggest that a large share of FDI
originated from within the GCC. However, over 23% of total FDI in Saudi Arabia came
24
Bahrain, Brunei Darussalam, Kuwait, Oman, Qatar, Saudi Arabia, United Arab Emirates
UMIC (16)
FDI flows, 2012
Malaysia
$10-49bn
||||||||||||||||||||||||||||||||||||||||||||||||||||||||||||||||||||||||||||||||||||||||||||||||||||||||||||||||||||||
Turkey
>$10bn
||||||||||||||||||||||||||||||||||||||||
Iran
$1.0-9.9bn
|||||||||||||||||||||
Kazakhstan
>$5bn
||||||||||||||||||||
Azerbaijan
$1-4.9bn
|||||||||||
Iraq
$1-4.9bn
|||||||||||
Jordan
$1-4.9bn
|||||||||||
Lebanon
$1-4.9bn
|||||||||||
Turkmenistan $1-4.9bn
|||||||||||
Algeria
$1-1.9bn
|||||
Tunisia
$1-1.9bn
|||||
Albania
$0.5-0.9bn
||
Gabon
$0.5-0.9bn
||
Maldives
$0.1-0.4bn
|
Suriname
<$0.1bn
Libya