
COMCEC Trade Outlook 2019
44
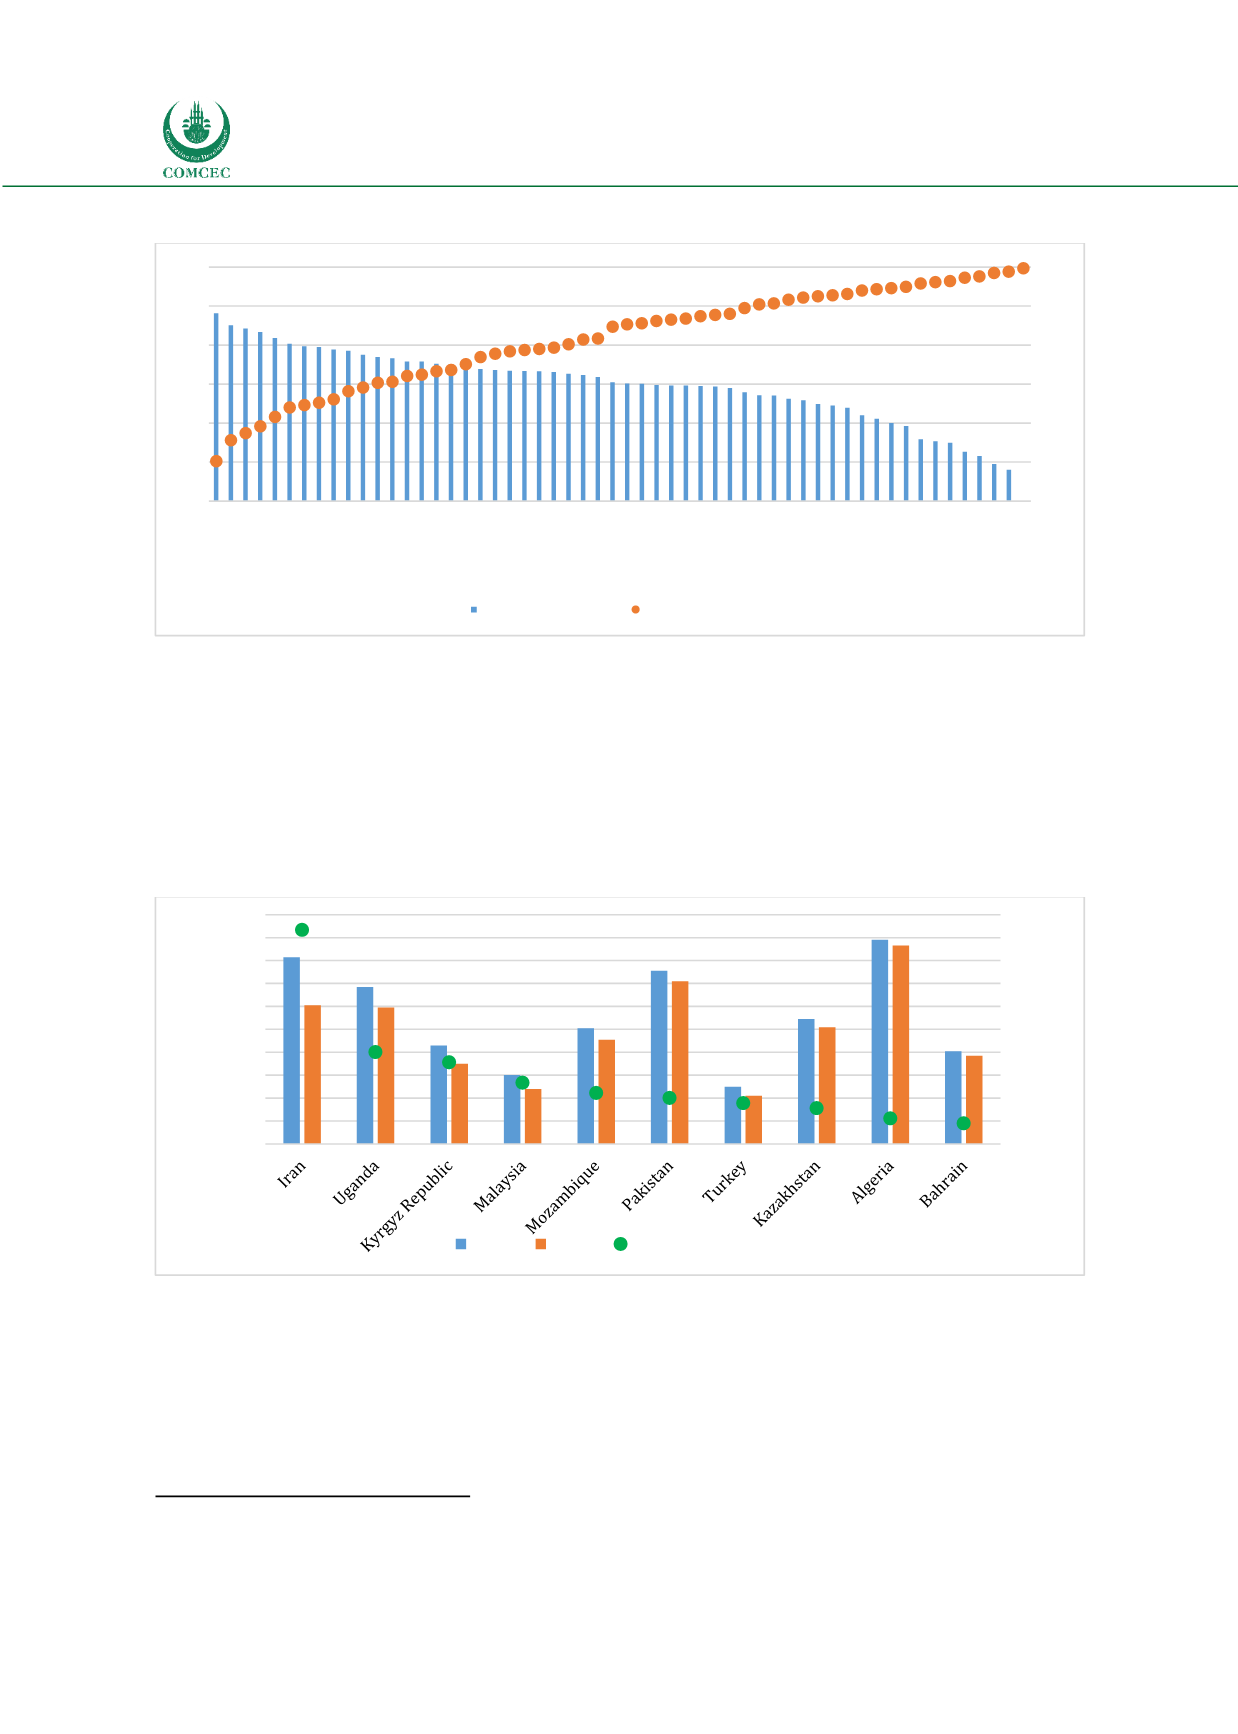
Figure 53: Trading Across Borders- Distance to Frontier Scores (DTF) and Ranks in the OIC
Source: World Bank Doing Business
Note: The countries are ranked according to their 2019 DTF scores
As shown in Figure 54 when the trading across borders ranks compared between WB Doing
Business 2019 and 2017 (which are the only comparable years due to the methodological
change) there are 17 OIC countries improving in Trading Across Borders indicators and moving
up in the rank e.g. Iran (up 42) is the most improving country followed by Uganda (up 18),
Kyrgyzstan (up 16), Malaysia (up 12) and Mozambique (up 10). Nine OIC countries experienced
no change at rank while thirty OIC countries worsened.
Figure 54: OIC Countries that Improved the Most at Trading Across Borders
Source: World Bank Doing Business 2019 data
Figures 55 and 56 illustrate border and documentary compliance costs and times for the lowest
and highest ranked OIC member states according to the distance to frontier scores for trading
across borders
27
. The figures reveal that the cost and times for trade substantially vary among
the OIC Member States.
27
The distance to frontier score shows how far on average an economy is from the best performance achieved by any
economy on WB-Trading Across Borders indicator.
-10
10
30
50
70
90
110
130
150
170
190
0
20
40
60
80
100
120
Albania
Turkey
Malaysia
Palestine
Morocco
Kyrgyz Republic
Oman
Jordan
Bahrain
Azerbaijan
Suriname
Mozambique
Mali
Qatar
UAE
Tunisia
Kazakhstan
Benin
Gambia
Indonesia
Comoros
Uganda
Burkina Faso
Iran
Niger
Libya
Togo
Senegal
Mauritania
Pakistan
Guinea-Bissau
Djibouti
Guyana
Tajikistan
Brunei
Lebanon
Maldives
Saudi Arabia
Kuwait
Côte d'Ivoire
Somalia
Uzbekistan
Sierra Leone
Guinea
Gabon
Egypt
Chad
Algeria
Bangladesh
Afghanistan
Syria
Iraq
Nigeria
Sudan
Cameroon
Yemen
Trading across Borders DTF
Trading across Borders rank
0
5
10
15
20
25
30
35
40
45
0
20
40
60
80
100
120
140
160
180
200
Change in Rank
Traing Across Borders Rank
2017 2019 Change in the Rank


