


 48 / 125

COMCEC Trade Outlook 2019
41
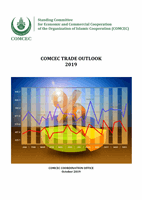
Figure 49: Evolution of the Openness Ratio
Source: UNCTADSTAT
F
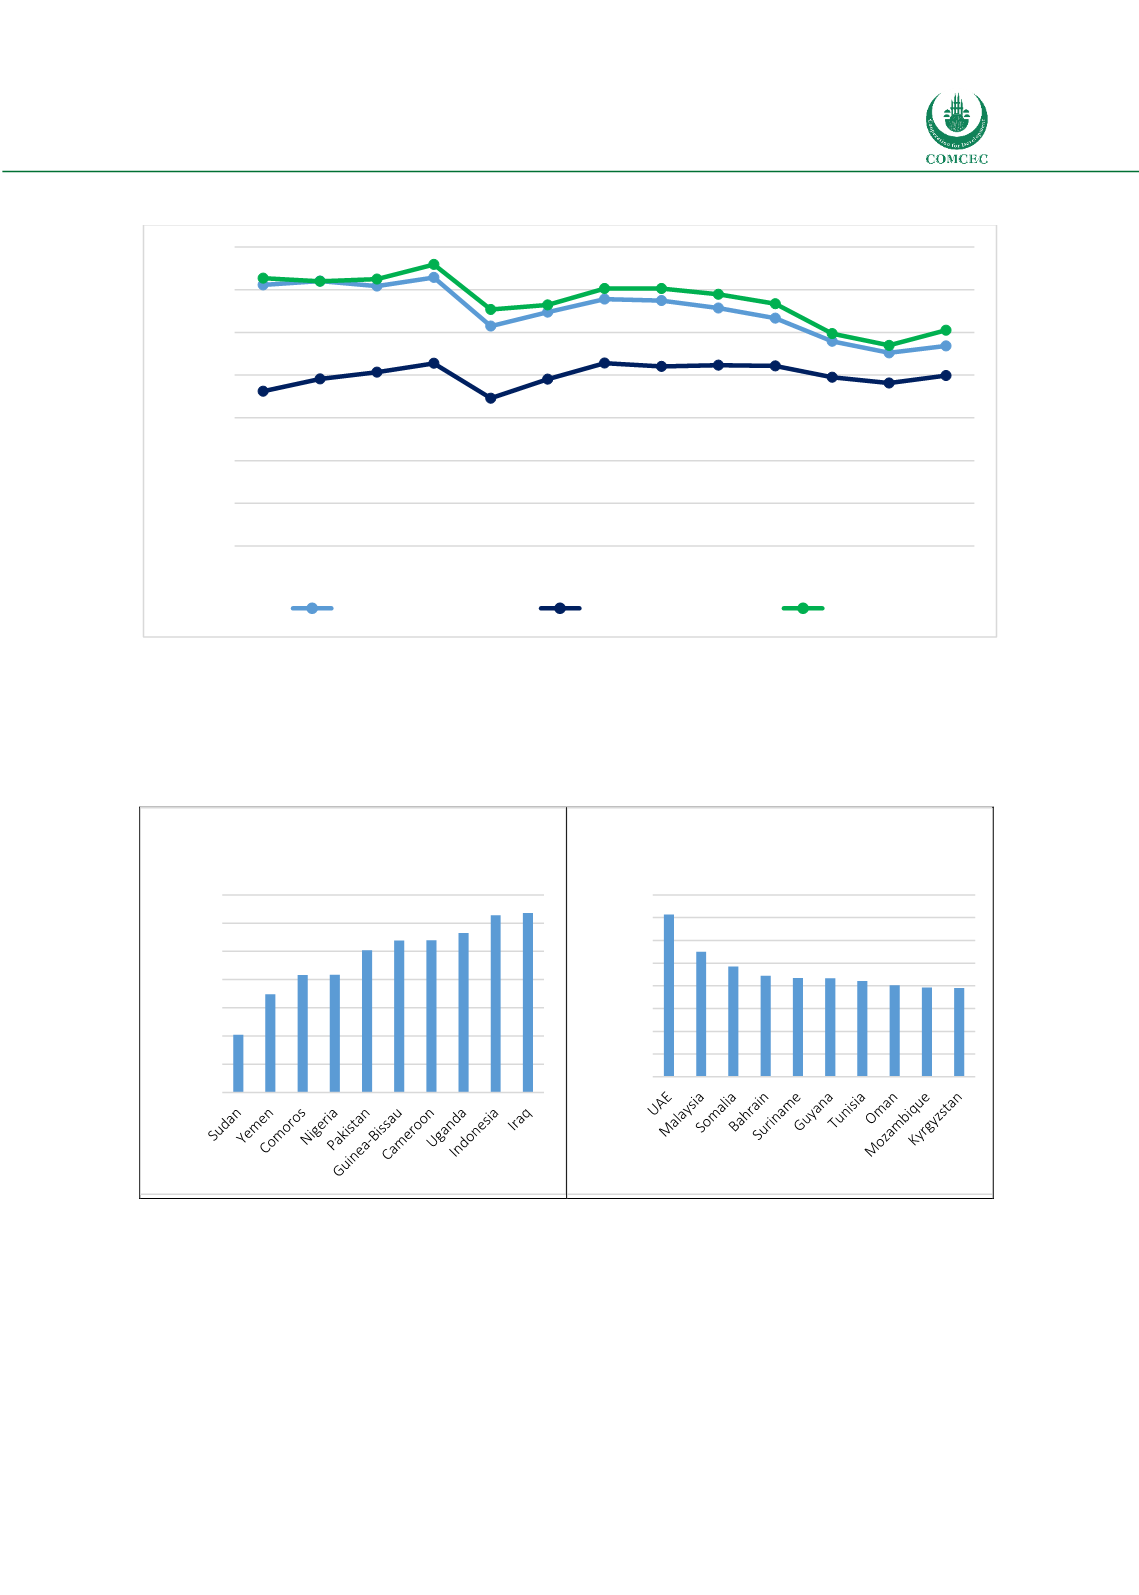
igure 50 shows top ten countries having the lowest and highest trade to GDP ratios in 2017.
UAE andMalaysia had the highest share of trade in GDPwith 142.5 and 106 per cent while Sudan
and Yemen with a trade to GDP ratio ranged between 10 to 17 per cent had the lowest openness
ratios.
Figure 50: Member States Having the Lowest and Highest Openness Ratios in 2017
Source: UNCTADSTAT
Trade Facilitation:
Trade facilitation is defined by UNECE as “the simplification,
standardization and harmonization of procedures and associated
information flows required to move goods from seller to buyer and
0
10
20
30
40
50
60
70
2005 2006 2007 2008 2009 2010 2011 2012 2013 2014 2015 2016 2017
Per cent
Developing economies
Developed economies
OIC
0
5
10
15
20
25
30
35
Per cent
Member States Having the Lowest
Openness Ratio
0
20
40
60
80
100
120
140
160
Per cent
Member States Having the Highest
Openness Ratio
“Trade Costs are
higher in Landlocked
Member States”