


 47 / 125

COMCEC Trade Outlook 2019
40
Source: WTO Tariff Profiles 2019 database
Note: Includes countries where data is available
Trade Openness in the OIC
One of the most common measure of openness is to evaluate the ratio of trade (the sum of value
of exports and imports of goods) to the gross domestic product (GDP). This could be interpreted
as the relative importance of trade to the economy.
The statistics by UNCTADSTAT indicates that openness ratio fell significantly in the aftermath
of the global crisis both in developing and developed countries, it recovered and increased
modestly in 2017.
The trade to GDP ratio in total OIC increased from 47 per cent in 2016 to 51 percent in 2017, it
is still below the levels of 2011 and 2012 which was 60 percent.
0 10 20 30 40 50 60 70
Egypt
Turkey
Sudan
Morocco
Algeria
Guyana
Uganda
Suriname
Jordan
Bangladesh
Côte d'Ivoire
Benin
Burkina Faso
The Gambia
Guinea-Bissau
Niger
Senegal
Togo
Guinea
Mali
OIC Average
Lebanon
World Average
Mozambique
Pakistan
Comoros
EU
Oman
Mauritania
Maldives
Tajikistan
Yemen
Kazakhstan
Bahrain
Afghanistan
Kyrgyz Republic
Indonesia
Malaysia
Albania
Saudi Arabia
UAE
Qatar
Kuwait
Brunei
0
5 10 15 20 25
Sudan
Algeria
Comoros
Bangladesh
Maldives
Mauritania
Pakistan
Egypt
Uganda
Côte d'Ivoire
Benin
Burkina Faso
The Gambia
Guinea-Bissau
Niger
Senegal
Togo
Guinea
Mali
Mozambique
Guyana
Suriname
OIC Average
Morocco
Jordan
World Average
Indonesia
Tajikistan
Yemen
Kyrgyz Republic
Afghanistan
Turkey
Kazakhstan
Malaysia
Saudi Arabia
Oman
Bahrain
Qatar
UAE
Kuwait
EU
Lebanon
Albania
Brunei
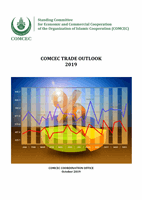
Figure 47: Simple Average Applied Tariffs on
Agricultural Products in OIC Countries-2018
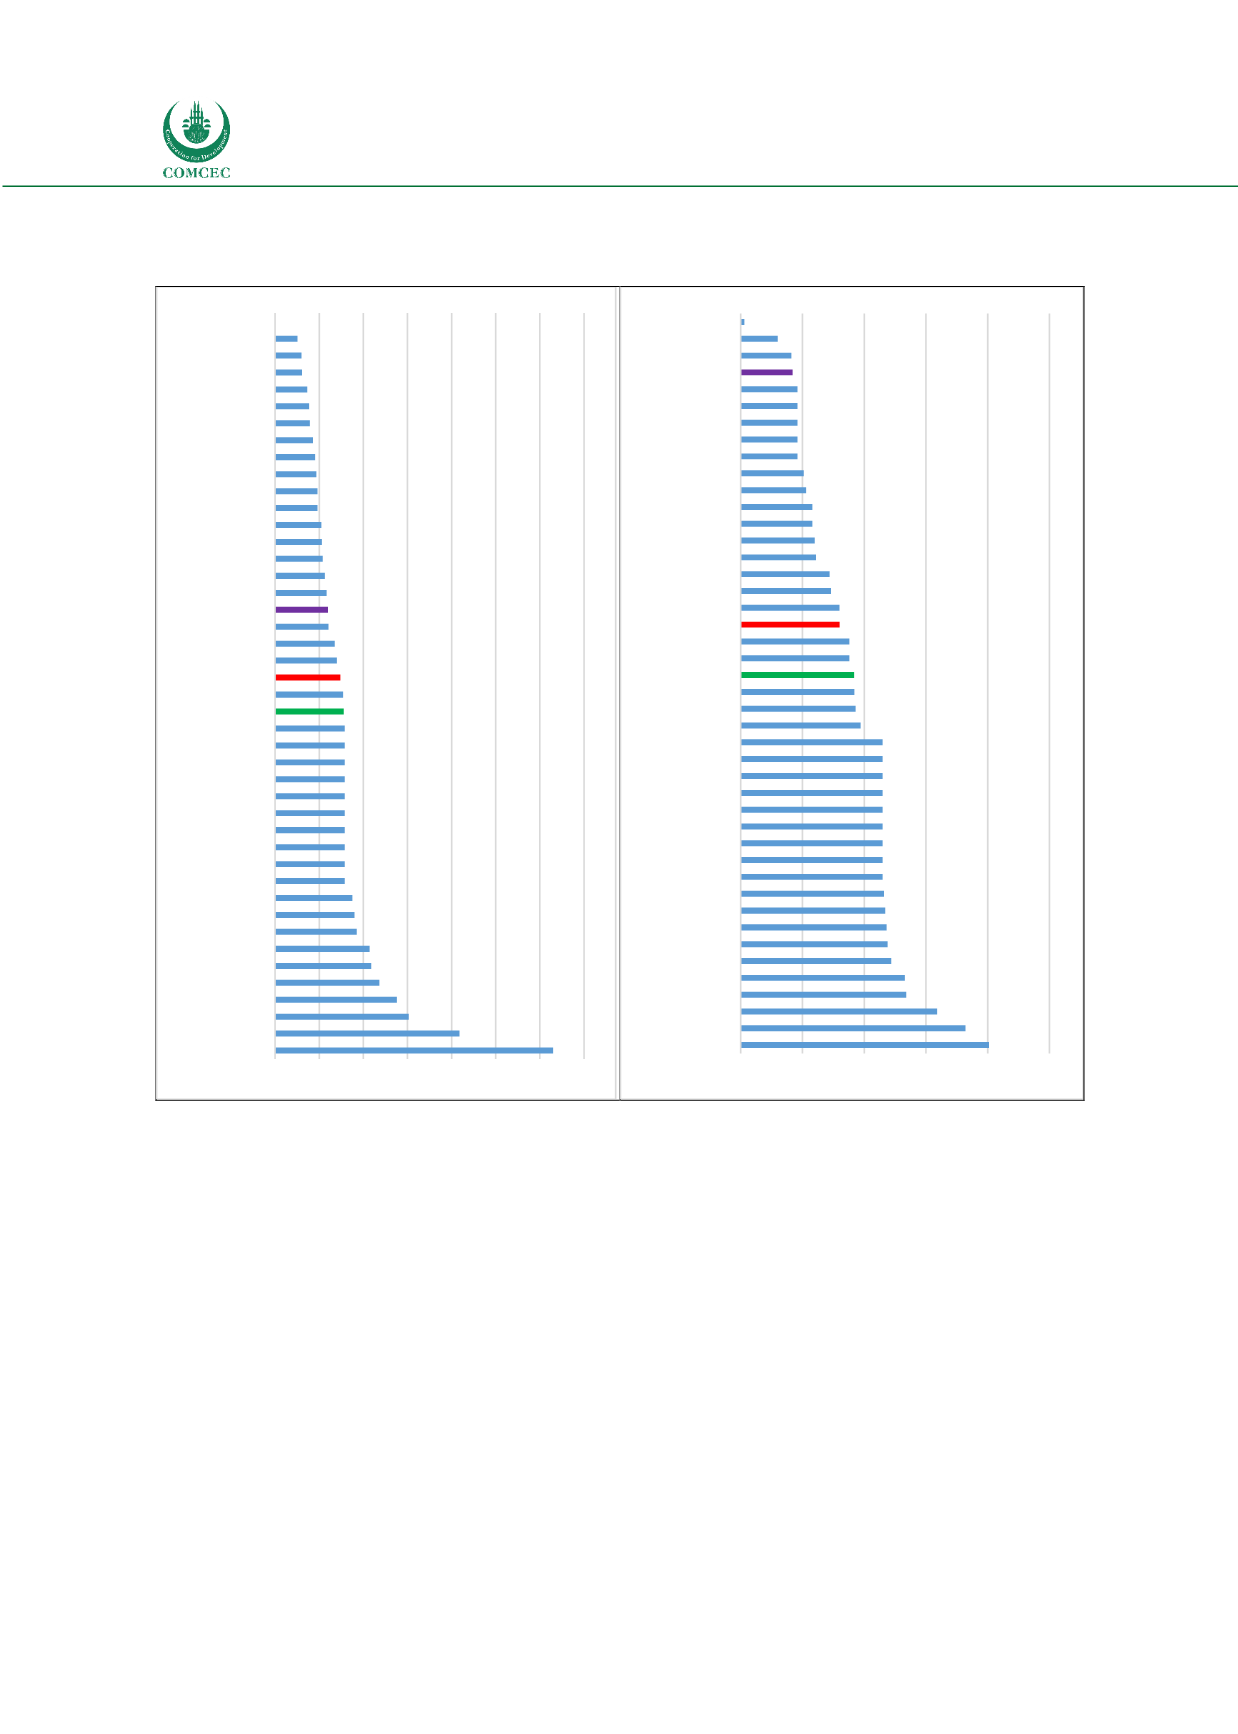
Figure 48: Simple Average Applied Tariffs on Non-
Agricultural Products in OIC Countries- 2018