


 22 / 101

COMCEC Agriculture Outlook 2017
12
66,4
81,5
80,4
64,8
63,3
67,2
0
10
20
30
40
50
60
70
80
90
0
50
100
150
200
250
2001
2005
2010
2014
2015
2016
Billion Dollar
Percentage
OIC Member Countries Agricultural Export
OIC Member CountriesAgricultural Import
5,56
7,47
9,65
8,95
9,20
8,73
7,81
8,65
11,66
13,58
14,08
12,72
0
2
4
6
8
10
12
14
16
18
20
2001
2005
2010
2014
2015
2016
Percentage
Share of OIC Agr. Exports in the World
Share of OIC Agr. Imports in the World
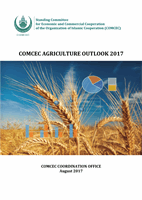
Figure 8. Agricultural Exports and Imports in the OIC
Source: Annex 11-13c, TRADEMAP
The export/import ratio which is a useful indicator for assessing trade performance is also
shown in Figure 8. While the ratio of exports to imports was around 66.4 percent in 2001, it
increased to almost 82 percent in 2010. Nonetheless, the export/import ratio has shown a
declining path in recent years. The poor performance of agricultural exports in 2016
negatively affected the export/import ratio, regressing it to almost back to 2001 level, 67.2
percent.
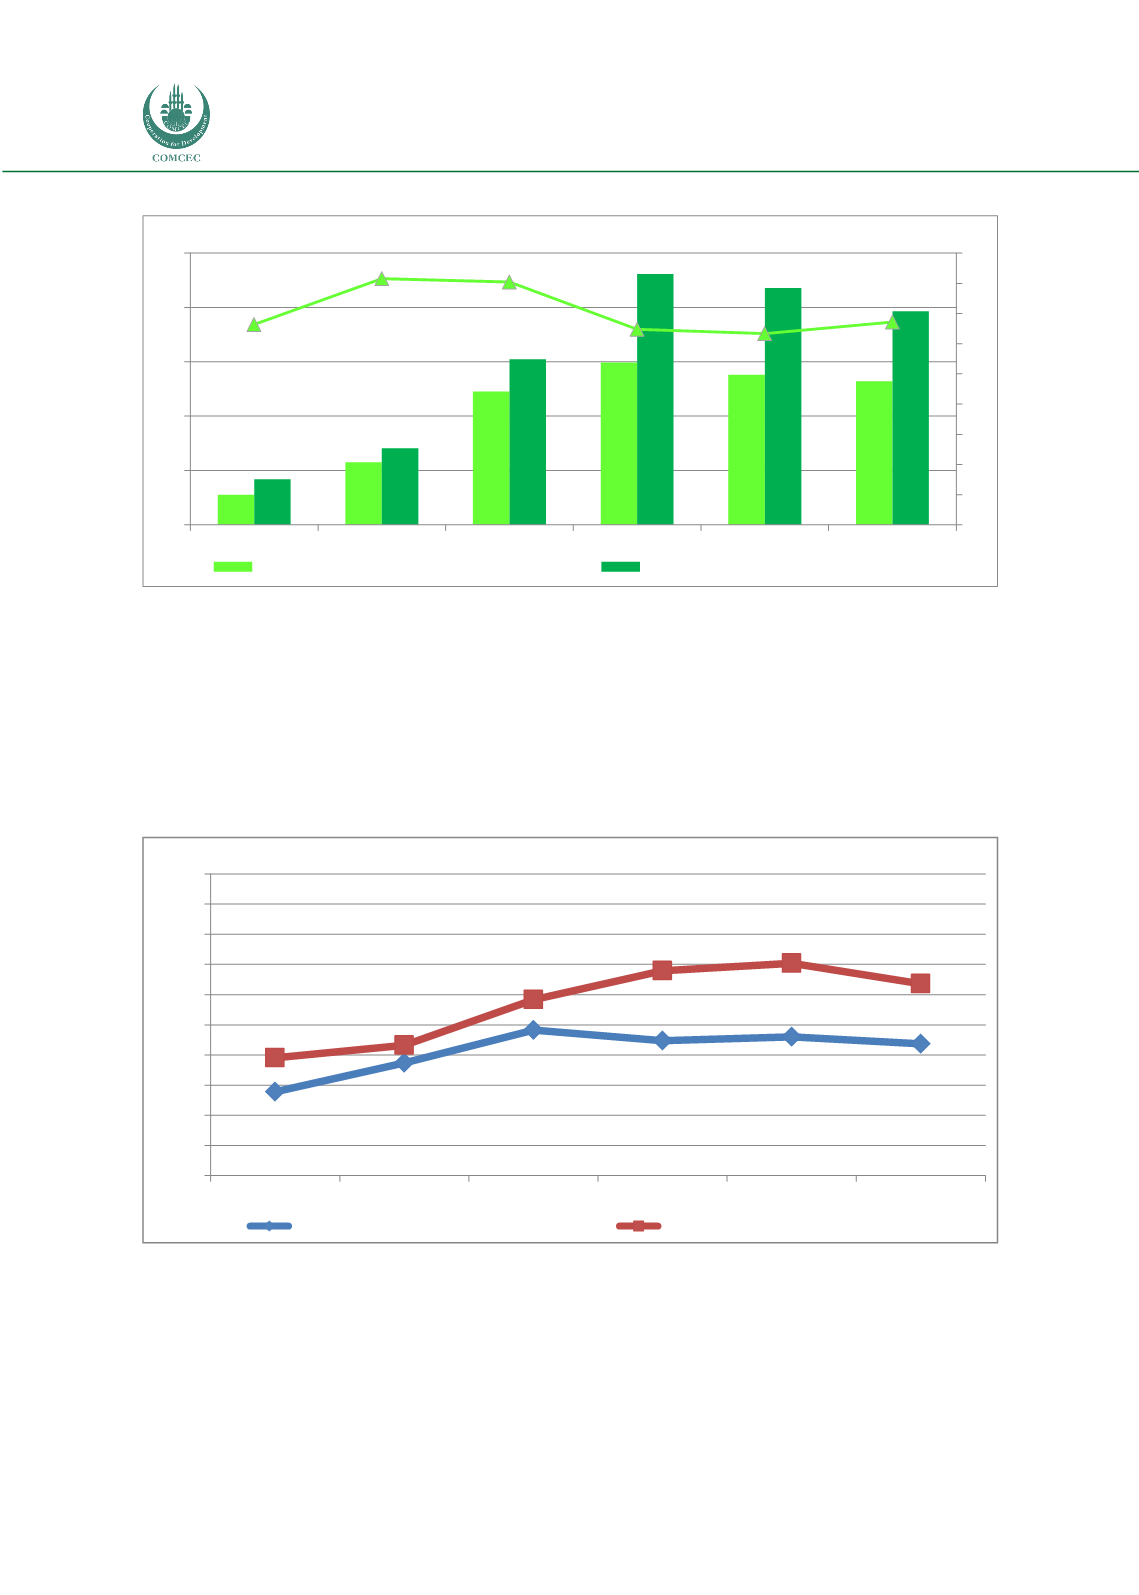
Figure 9. OIC Agricultural Trade Performance of OIC Member Countries in the World
Source: Annex 11-13c, TRADEMAP
Figure 9 illustrates OIC’s agricultural trade performance in the world. The share of OIC
member countries’ agricultural imports in the world increased to 12.72 percent in 2016 from
7.81 percent in 1990. Correspondingly, the contribution of OIC agricultural exports to world
total agricultural export reached 8.73 percent. Both agricultural imports and exports have
significantly risen in the period of 2005-2014. During the 2014-2016 period, while the share of