


 25 / 101

COMCEC Agriculture Outlook 2017
15
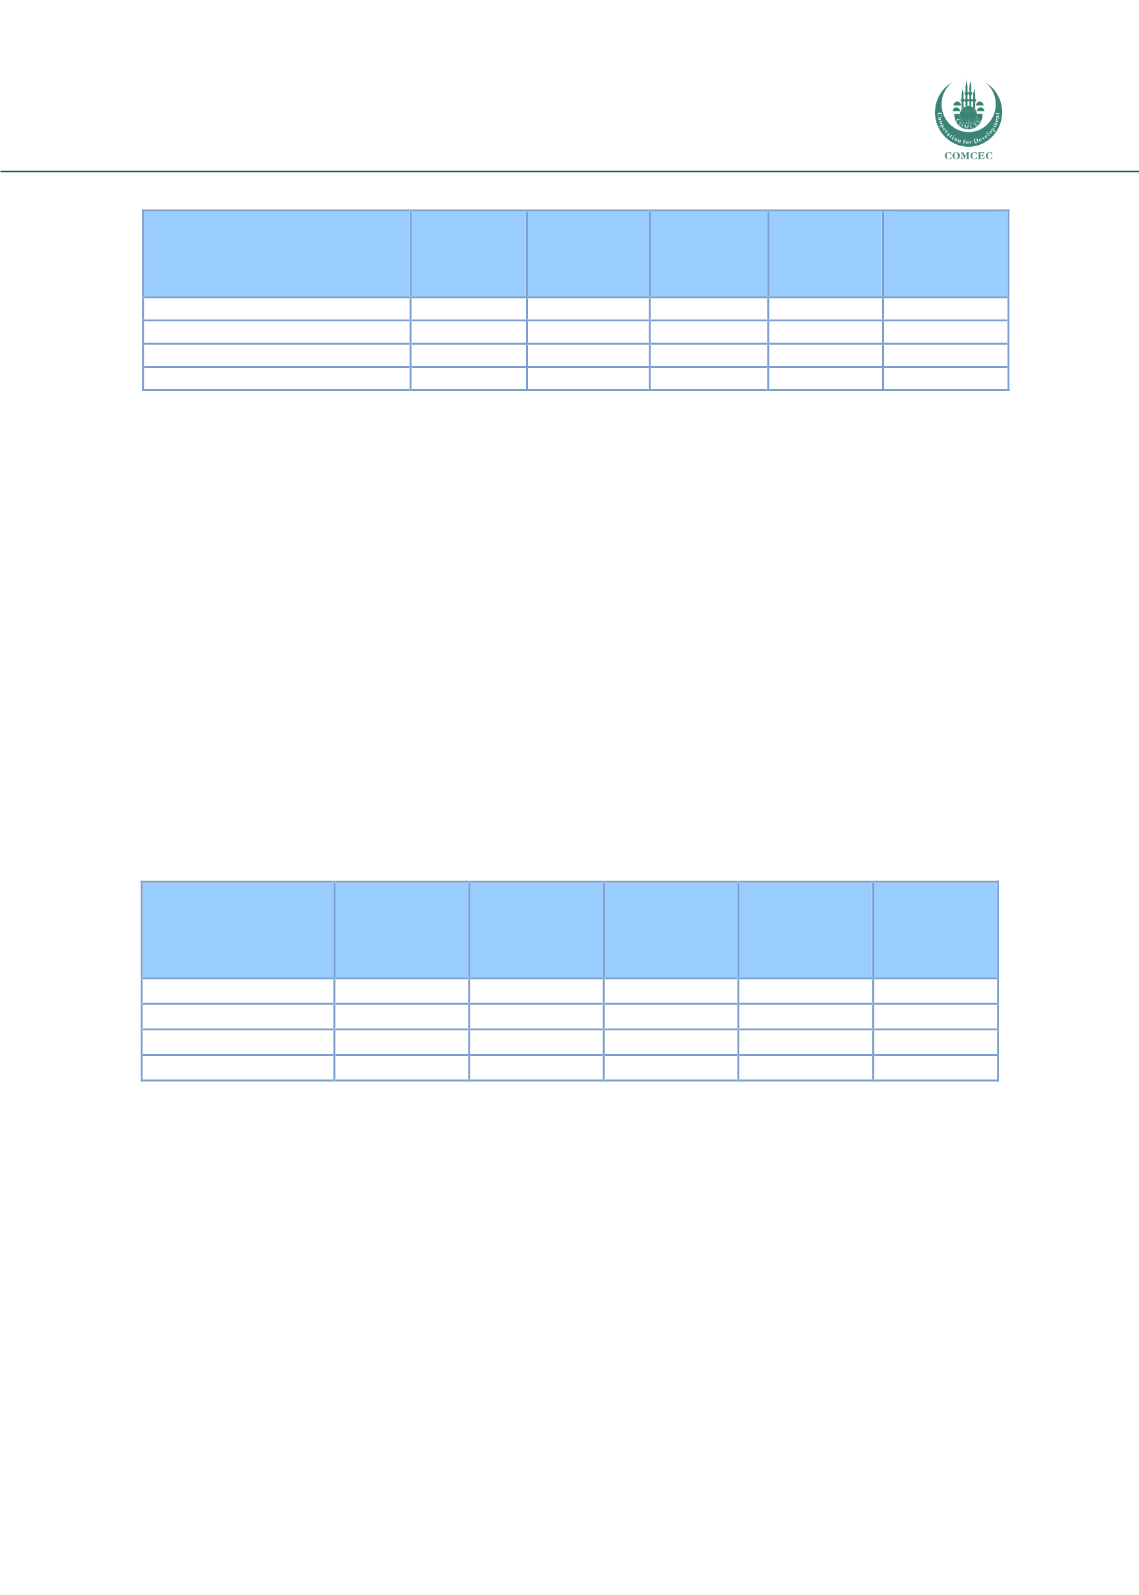
Table 5. Land Use in the OIC and its Share in the World, 2014
Total Land
Area
Agricultural
Area
Arable land
Permanent
Crops
Permanent
Meadows
and
Pastures
OIC (million ha)
3,179
1,409
306
63
1,022
Share in Total Agr. Area (%)
100.0
21.7
4.5
73.2
World (million ha)
13,009
4,929
1,408
165
3,354
Share of OIC in the World (%)
24.4
28.6
21.8
38.2
31.0
Source: FAOSTAT
Table 5 provides data on magnitudes of total land, agricultural land, permanent crops land and
permanent meadows, and pastures in the OIC member countries as well as in the world. OIC
member countries’ total land area of 3.2 billion hectares, equals to 24 percent of the world’s
total land area. Almost 1.4 billion hectares, representing 44 percent of this total land is used as
agricultural land by the OIC member countries. The OIC’s agricultural area share in total land
area is higher than the world average of38 percent.
In the OIC, out of these 1.4 billion hectares of agricultural area, 306 million hectares are arable
land, 63 million hectares are reserved for permanent crops, and more than 1 billion hectares
are used as permanent meadows and pastures. Most of OIC member countries’ agricultural
area, (74 percent), consists of permanent meadows and pastures. This is in line with the
general distribution in the world where 68 percent of agricultural area consists of permanent
meadows and pastures. When compared to EU countries, where 60 percent of the agricultural
land is arable, 33 percent consists of permanent meadows and pasture and 6 percent is
allocated to permanent crops, the OIC member countries as a whole have a very high level of
permanent meadows and pastures, but very low share of arable land.
Table 6. The Shares of Land Use in OIC Sub-Regions, 2014
OIC Sub-region
Land area
Agricultural
Area
Arable land
Permanent
Crops
Permanent
Meadows
and
Pastures
African Group (%)
24.2
25.3
33.8
27.8
22.6
Arab Group (%)
42.8
36.9
18.3
13.3
43.7
Asian Group (%)
33.0
37.9
47.9
58.9
33.6
OIC Total (%)
100.0
100.0
100.0
100.0
100.0
Source: FAOSTAT
Table 6 reveals that Arab and Asian Groups constitute 37 and 38 percent of the total
agricultural area of the OIC. They are followed by the African Group with 25 percent. Arab
Group has the highest share in permanent meadows and pastures of OIC with 44 percent.
Asian Group has the highest share in the arable and permanent crop areal with 48 and 59
percent, respectively.
At the individual country level, Kazakhstan with 15.4 percent, Saudi Arabia with 12.3 percent,
Sudan with 7.7 percent, Nigeria with 5.0 percent, and Indonesia with 4.0 percent, own
significant portion of OIC’s agricultural land. Regarding the arable land, the country ranking
list changes slightly, and Nigeria becomes the first country which has the highest share of
arable land with 11.1 percent in the OIC. Pakistan Kazakhstan, Indonesia and Turkey are the