


 23 / 101

COMCEC Agriculture Outlook 2017
13
agricultural commodity exports of the OIC Member Countries stabilized, the contribution of
OIC agricultural imports to total world agricultural imports started to decline.
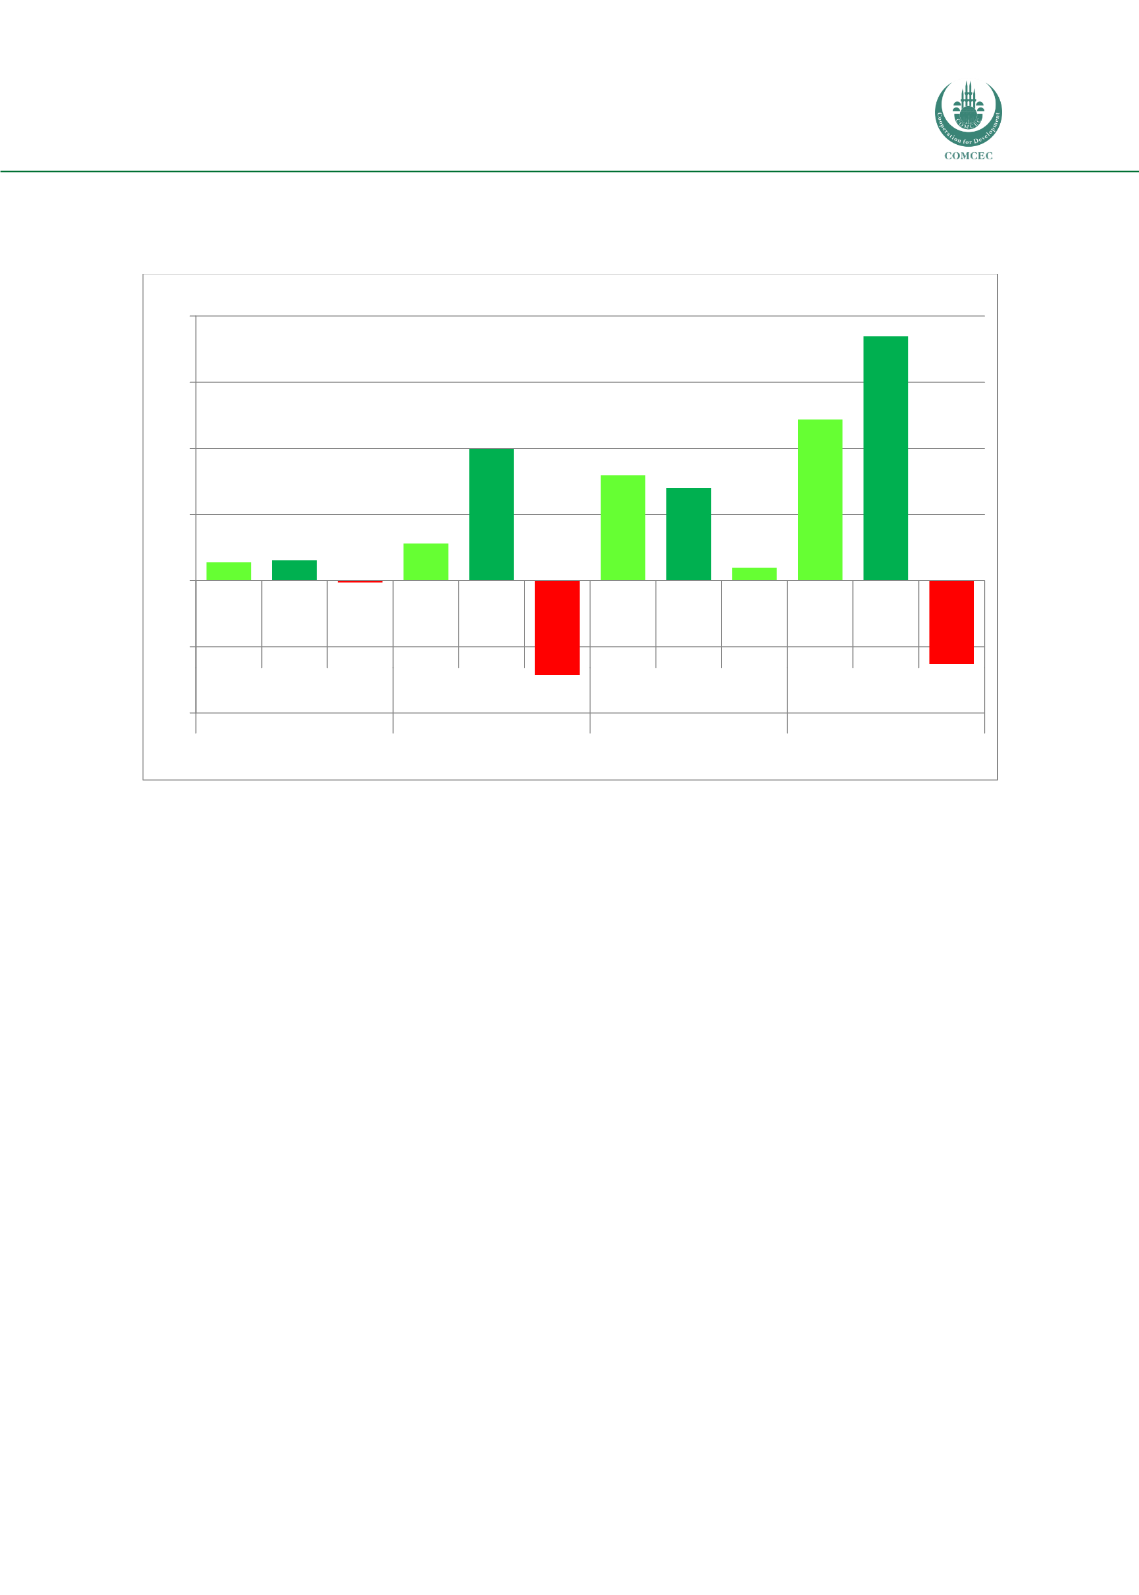
Figure 10. Agricultural Trade Balance in the OIC by Sub-Regions, 2016
Source: TRADEMAP
Most of the OIC member countries have trade deficits in agriculture. As of 2016, 63.0 billion US
Dollars trade deficit occurred in the OIC. Figure 10 illustrates the agricultural trade balance in
the OIC Sub-Regions in 2016. The only group which had a positive trade balance was the Asian
Group with 9.7 billion US Dollars. On the other hand, African and Arab Groups have registered
trade deficits of 1.4 and 71.3 billion US Dollars, respectively.
At the sub-regional level, Asian Group had the highest share in OIC’s agricultural commodity
exports with 66.9 percent in 2016. Asian Group was followed by Arab and African Groups with
21.8 percent and 11.3 percent respectively. In terms of agricultural commodity imports, Arab
Group accounted for 52 percent of the OIC’s total in the same period. It was followed by Asian
and African Groups with 40 percent and 8 percent, respectively (Figure 10).
The Annexes 13b and 13c illustrate the first 15 partner countries and products in the OIC’s
regional level exports and imports. The African Groups countries have trade networks with
partner countries in the other regions with lowest intra-OIC trade share in its agricultural
exports, 7.4 percent while the Arab Group and Asian Group countries has an intra-OIC trade
share of 45,73 and 11 percent respectively. The Asian Group Countries also have a higher
share of its own regional export of 36.1 percent. The same is true for the case of OIC’s imports.
The product group of cereals is the top item in OIC’s imports of different regional group of
countries following by dairy and meat products. The OIC Regions have their regional specialty
items as top export items, namely, cocoa for African, nuts for Arab and edible oils for Asian
Countries.
14,0
15,4
-1,4
28,1
99,4
-71,3
79,8
70,0
9,7
121,9
184,9
-63,0
-100
-50
0
50
100
150
200
Exports Imports Trade
Balance
Exports Imports Trade
Balance
Exports Imports Trade
Balance
Exports Imports Trade
Balance
African Group
Arab Group
Asian Group
OIC Total
Billion Dollar