


 17 / 101

COMCEC Agriculture Outlook 2017
7
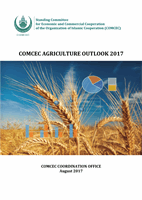
Table 1. Agricultural GDP Rankings in the OIC
2014
2015
Agricultural GDP
(Billion Dollar)
Share of Agri.
in GDP,%
Agricultural GDP
(Billion Dollar)
Share of
Agri. in
GDP,%
1
Indonesia
118,8
13,3
Indonesia
116,5
13,5
2
Nigeria
113,6
20,0
Nigeria
102,0
20,6
3
Pakistan
59,2
23,9
Pakistan
64,0
24,0
4
Turkey
57,1
7,2
Turkey
54,7
7,6
5
Iran
38,9
9,1
Egypt
35,7
11,3
6
Egypt
34,1
11,5
Iran
34,4
8,6
7
Malaysia
30,0
8,9
Bangladesh
28,7
14,8
8
Bangladesh
26,6
15,4
Sudan
26,4
28,4
9
Sudan
23,1
27,0
Malaysia
25,0
8,5
10
Algeria
22,0
10,3
Algeria
19,2
11,7
Top Ten Total
523,4
Top Ten Total
506,8
77,6
OIC Total
682,6
OIC Total
653,5
World
3306,5
World
3132,9
Source: Annexes 2-6
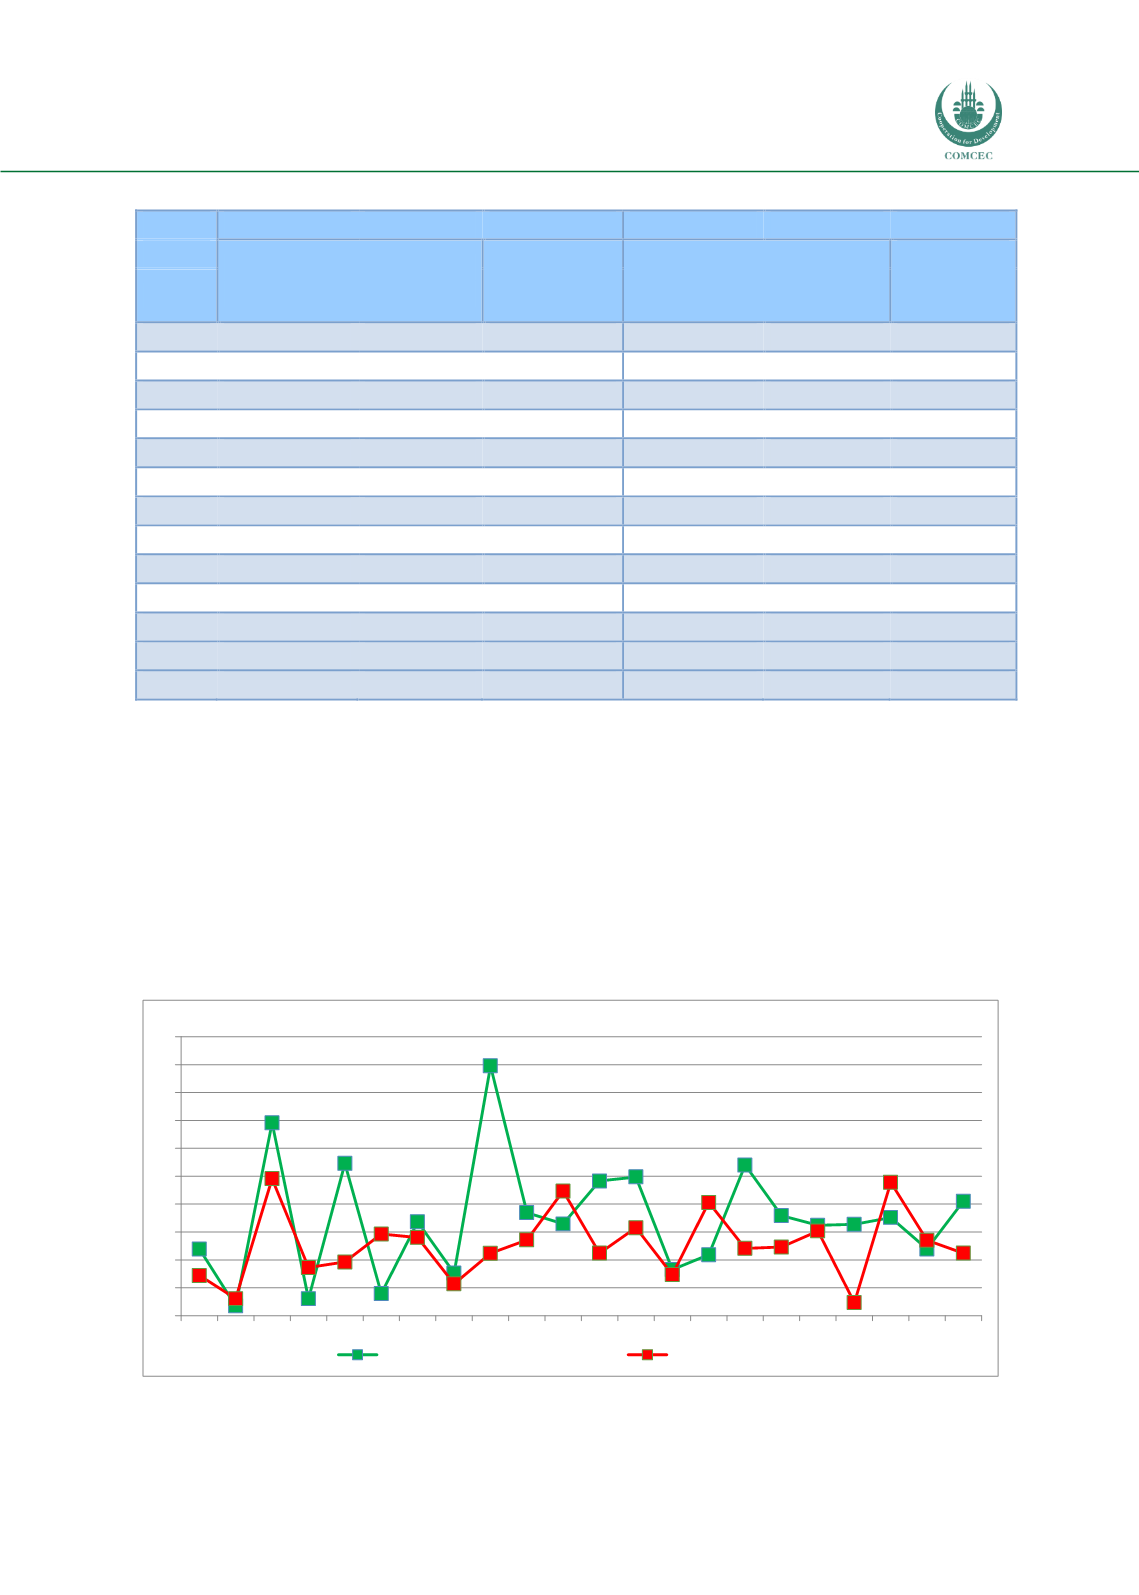
1.2.
Agricultural Growth Rates
The growth rate can be calculated as nominal or real growth, and can be used to measure the
performance of economies as a whole or particular sectors during selected time intervals.
Since the agricultural sector heavily depends on external factors such as rainfall, temperature,
climate change, humidity and soil condition, the real growth rates, adjusted for price effects
have shown a fluctuating path over the years.
Figure 5. Agricultural Growths in the OIC and World
Source: Annexes 2-6
0
1
2
3
4
5
6
7
8
9
10
1994 1995 1996 1997 1998 1999 2000 2001 2002 2003 2004 2005 2006 2007 2008 2009 2010 2011 2012 2013 2014 2015
Percent
OIC Agr. Growth Rate
World Agr. Growht Rate